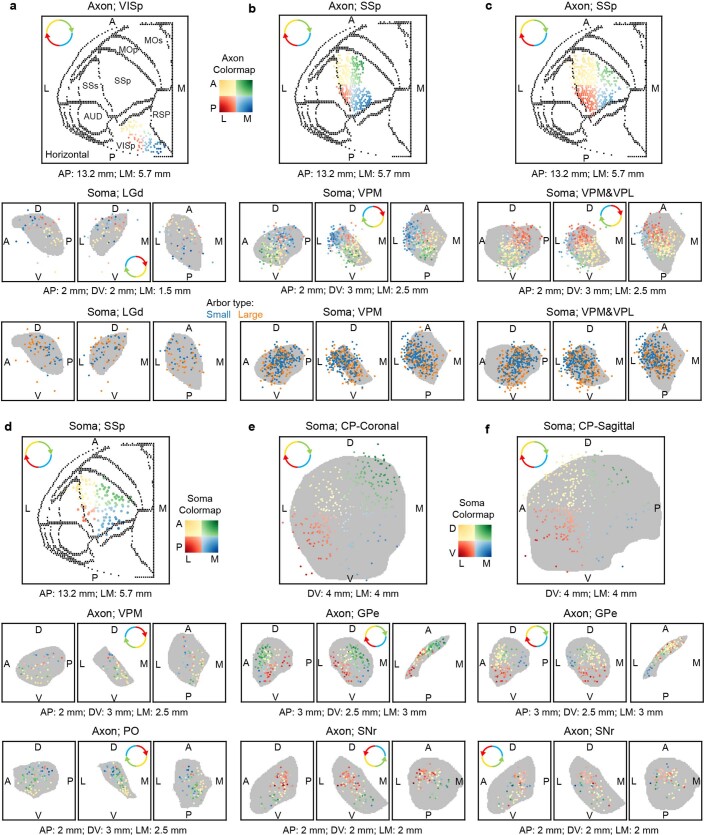
Extended Data Fig. 15. Topography analysis.
a–c, Topographic distribution of the somas of LGd (a), VPM (b) and VPM&VPL (c) neurons and their terminal axon arbors in cortex. Top panels, axon arbors are shown in VISp (for LGd neurons) and SSp (for VPM and VPM&VPL neurons) in a cortical flatmap and divided into color-coded quadrants. Middle panels, corresponding soma locations labeled with the same color code are shown in LGd, VPM and VPM&VPL. Each color wheel with arrows denotes the observed general topographic orientation. Bottom panels, soma locations of neurons with small or large axon arbors. d, Topographic distribution of the somas of SSp L5 ET neurons and their terminal axon arbors in thalamus. Top panel, somas are shown in SSp in a cortical flatmap and divided into color-coded quadrants. Middle and bottom panels, corresponding axon arbor locations labeled with the same color code are shown in VPM and PO, respectively. e, f, Topographic distribution of the somas of CP neurons and their terminal axon arbors, shown in a coronal flatmap (e) or a sagittal flatmap (f). Top panels, somas are shown in CP in two projected planes, dorsoventral-mediolateral (e) and dorsoventral-anteroposterior (f), each divided into color-coded quadrants. Middle and bottom panels, corresponding axon arbor locations labeled with the same color code are shown in GPe (for GPe-projecting neurons) and SNr (for SNr-projecting neurons), respectively.

