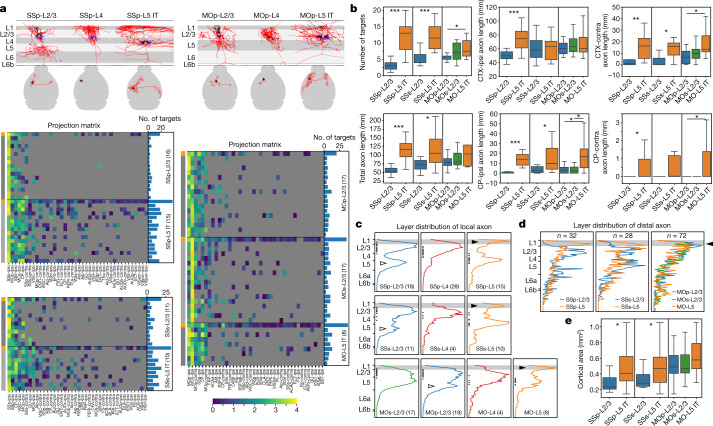
Fig. 2. Local morphology and long-range projection of cortical L2/3, L4 and L5 IT neurons.
a, Projection matrices comparing long-range projection patterns between individual neurons and mesoscale population-level projections, and between L2/3 and L5 IT neurons in each cortical region. Example SSp and MOp neurons are shown above the matrices, with their local morphologies (top row; apical dendrite in black, basal dendrite in blue, axon in red and soma as an orange dot) and intracortical long-range projections (bottom row; axon in red and soma as a star). The first row of each matrix (labelled orange in the side bar) shows the mesoscale projection pattern for each cell type and region, collapsed from multiple mesoscale experiments. Each of the subsequent rows shows the projection pattern for a single neuron. Bar graphs to the right show the number of projection target regions for each mesoscale or single cell. MOs and MOp L5 IT neurons are grouped together owing to low numbers in each region. Heat map colours represent projection strengths, defined as ln(NPV × 100 + 1) for mesoscale experiments and ln(axon length) for single cells, where NPV is normalized projection volume. Target regions are defined using thresholds of ln(NPV × 100 + 1) > 0.2 for mesoscale experiments and axon length > 1 mm for single cells. Regions below the thresholds are shown in grey. The same definitions are used for all other figures. b, Comparison of numbers of targets and axon lengths between L2/3 and L5 IT neurons across different regions. In all figures, box edges in box plots show 25th and 75th percentiles, the centre line shows the 50th percentile, and bars show 1.5× the interquartile range (75th percentile – 25th percentile). c, Comparison of vertical profiles of local axon projections among L2/3, L4 and L5 IT neurons. Vertical profiles are combined from all neurons in each type and region (with numbers of cells in parentheses). Soma locations are indicated as dots along the left edge of each plot. Black and white arrowheads point to axon projection differences observed in L1 and L5, respectively. d, Comparison of cumulative vertical profiles of distal axon projections in target cortical regions between L2/3 and L5 IT neurons across different source regions. The black arrowhead points to the axon projection difference observed in L1. e, Comparison of the tangential span of distal axon projections in target cortical regions between L2/3 and L5 IT neurons across different source regions. Cell numbers in parentheses in a are used for quantifications in b, e. *P < 0.05, **P < 0.001, ***P < 0.0001, two-sided Mann-Whitney U test, without adjustment for multiple comparison. ACAd, anterior cingulate area, dorsal part; ACB, nucleus accumbens; AId, agranular insular area, dorsal part; AIp, agranular insular area, posterior part; AUDd, dorsal auditory area; AUDp, primary auditory area; AUDv, ventral auditory area; BLA, basolateral amygdalar nucleus; BST, bed nuclei of the stria terminalis; CEA, central amygdalar nucleus; ENTI, entorhinal area, lateral part; EPd, endopiriform nucleus, dorsal part; FRP, frontal pole; FS, fundus of striatum; ORBl, orbital area, lateral part; PIR, piriform area; PL, prelimbic area; RSPagl, retrosplenial area, lateral agranular part; RSPd, retrosplenial area, dorsal part; VISa, anterior visual area; VISal, anterolateral visual area; VISam, anteromedial visual area; VISl, lateral visual area; VISli, laterointermediate visual area; VISp, primary visual area; VISpm, posteromedial visual area; VISpor, postrhinal area; VISrl, rostrolateral visual area; contra, contralateral; ipsi, ipsilateral.

