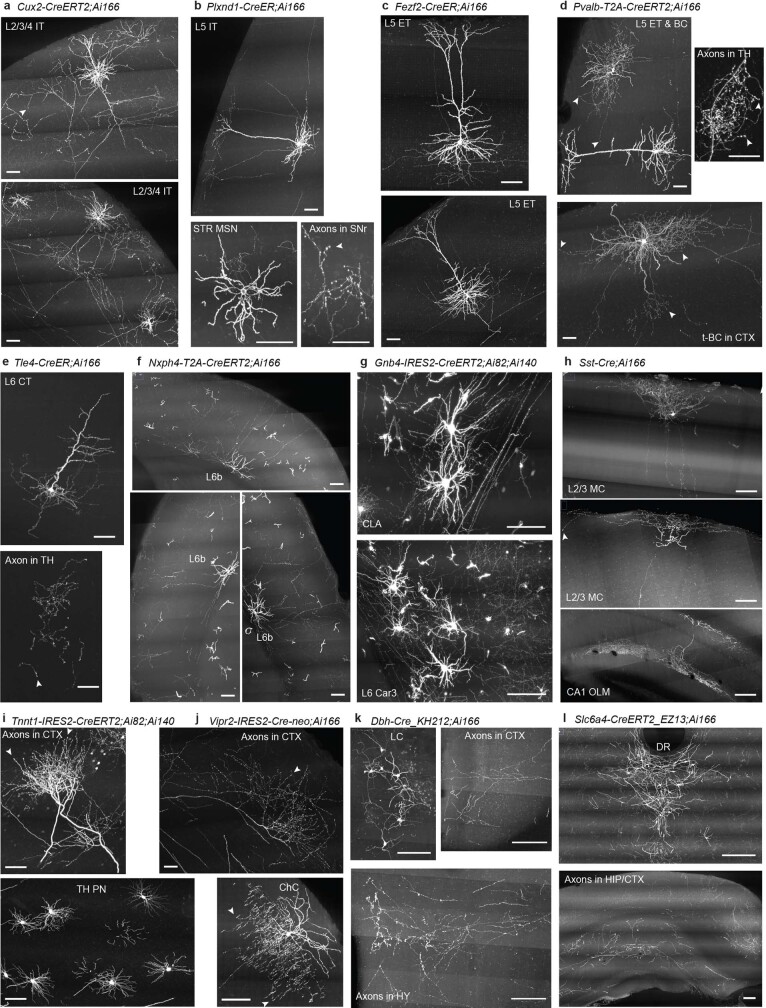
Extended Data Fig. 2. Sparse, robust and consistent labeling and visualization of the dendritic and axonal arborizations of a wide range of neuronal types.
Images shown are 100-µm maximum intensity projection (MIP) images (i.e., projected from 100 consecutive 1-µm image planes). Arrowheads indicate observed terminal boutons at the end of the axon segments. Number of fMOST imaged brains per mouse line and tamoxifen induction conditions are shown in Supplementary Table 1. Scale bars, 100 µm. a, Cortical L2/3/4 IT neurons and their extensive local axon collaterals clearly labeled in a Cux2-CreERT2;Ai166 brain. b, Cortical L5 IT neurons and their local axon collaterals seen in a Plxnd1-CreER;Ai166 brain. Striatal medium spiny neurons (STR MSN) are also sparsely labeled, and their individual axons are clearly seen in substantia nigra, reticular part (SNr). c, Cortical L5 ET neurons and their sparse local axon collaterals seen in a Fezf2-CreER;Ai166 brain. d, Cortical inhibitory basket cells (BC) and translaminar basket cells (t-BC), as well as L5 ET excitatory neurons, seen in a Pvalb-T2A-CreERT2;Ai166 brain. The L5 ET neurons form driving-type axon clusters with large boutons in the thalamus (TH). e, Cortical L6 CT neurons and their characteristic apical dendrites not reaching L1, as well as local axon collaterals and long-range axon projections into thalamus (TH), labeled in a Tle4-CreER;Ai166 brain. f, Cortical L6b neurons and their local axon projections up into L1 seen in a Nxph4-T2A-CreERT2;Ai166 brain. g, Gnb4+ claustral (CLA) and cortical (L6 Car3) neurons with their widely dispersed axon fibers seen in a Gnb4-IRES2-CreERT2;Ai140;Ai82 brain. h, Cortical inhibitory Martinotti cells (MC) and hippocampal CA1 OLM cells labeled in a Sst-Cre;Ai166 brain. i, Thalamic projection neurons (TH PN) with their dense axon terminal clusters in cortex seen in a Tnnt1-IRES2-CreERT2;Ai82;Ai140 brain. j, In a Vipr2-IRES2-Cre-neo;Ai166 brain, axon clusters from projection neurons in visual thalamic nuclei are seen in cortex (CTX), and a cortical chandelier cell (ChC) is fully labeled with its characteristic axonal branches. Vipr2-IRES2-Cre-neo;Ai166 also labels axons consistent with projections from retinal ganglion cells63, which are not shown here. k, Noradrenergic neurons labeled in the locus ceruleus (LC), and their long-range axon fibers seen in CTX and hypothalamus (HY) in a Dbh-Cre_KH212;Ai166 brain. l, Serotonergic neurons labeled in the dorsal raphe (DR), and their long-range axon fibers seen in hippocampus (HIP) and CTX in a Slc6a4-CreERT2_EZ13;Ai166 brain. Overall, it is apparent that these neurons display a remarkable array of dendritic and axonal morphologies. Specifically, in these sparsely labeled brains, cortical IT, ET and CT neurons not only have primary long-range projections but also local axonal branches that are well segregated and clearly identifiable, enabling truly complete reconstruction of the entire local and long-range, cortical and subcortical axonal arborization (a–e). L5 ET neurons form the ‘driving’ type of synapses in the thalamus34,64, which have enlarged and intensely fluorescent boutons (d). L6b subplate neurons extend their local axon collaterals upwards into layer 1 (f). The axons of thalamic projection neurons form either dense or dispersed clusters in the cortex (i, j). On the other hand, claustral, noradrenergic and serotonergic neurons have widely dispersed, thin axons that are nonetheless well labeled (k, l). One can also clearly see individual axons in the substantia nigra from striatal medium spiny neurons (b), as well as dense and fine local axonal branches of a variety of cortical interneurons (e.g., basket cells, Martinotti cells and chandelier cells) (d, h, j). Of note, sparsely labeled neurons were frequently observed in other regions of the brain for all of these crosses but are not described in detail here. Each of these brains contains ~100-1,000 labeled neurons (Supplementary Table 1). Thus, tens of thousands of neurons could be reconstructed from these and newly generated datasets in the coming years. The whole brain image datasets are publicly available as a unique resource for the community.

