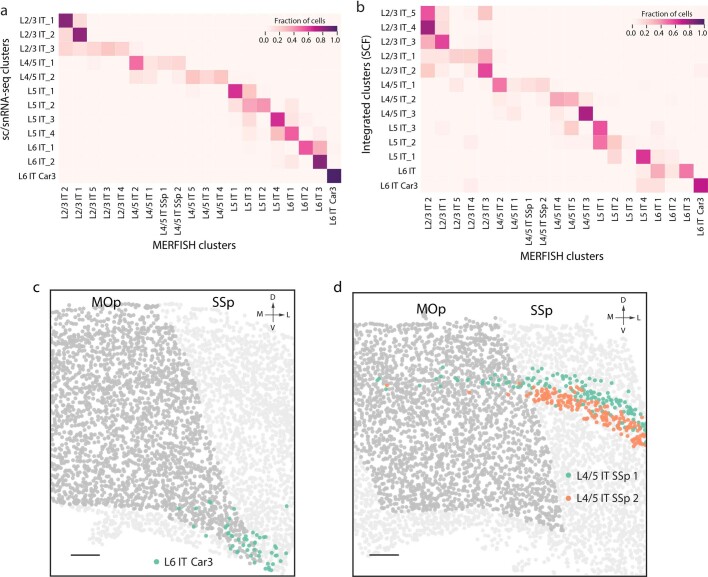
Extended Data Fig. 7. Correspondence between the MERFISH IT clusters and the IT clusters determined by scRNA-seq and snRNA-seq analysis and by integrated analysis, and spatial distributions of L6 IT Car3 and L4/5 IT SSp 1 and 2 clusters.
a, Correspondence between the IT clusters identified by MERFISH and those identified by scRNA-seq and snRNA-seq. b, Correspondence between the IT clusters identified by MERFISH and those identified by the integrated clustering analysis of scRNA-seq, snRNA-seq, snATAC-seq and snmC-seq using SingleCellFusion23. The correspondence in a and b is determined using a classifier approach as described in Extended Data Fig. 2c. c, A coronal slice (Bregma approximately +1.1) highlighting the L6 IT Car3 cluster (green). d, A coronal slice (Bregma approximately +0.9) highlighting the L4/5 IT SSp 1 (green) and L4/5 IT SSp 2 (orange) clusters. In both c and d, all other cells within the MOp are coloured in dark grey to highlight the MOp region, and all other cells outside the MOp are shown in light grey. Scale bars, 200 μm (c, d).

