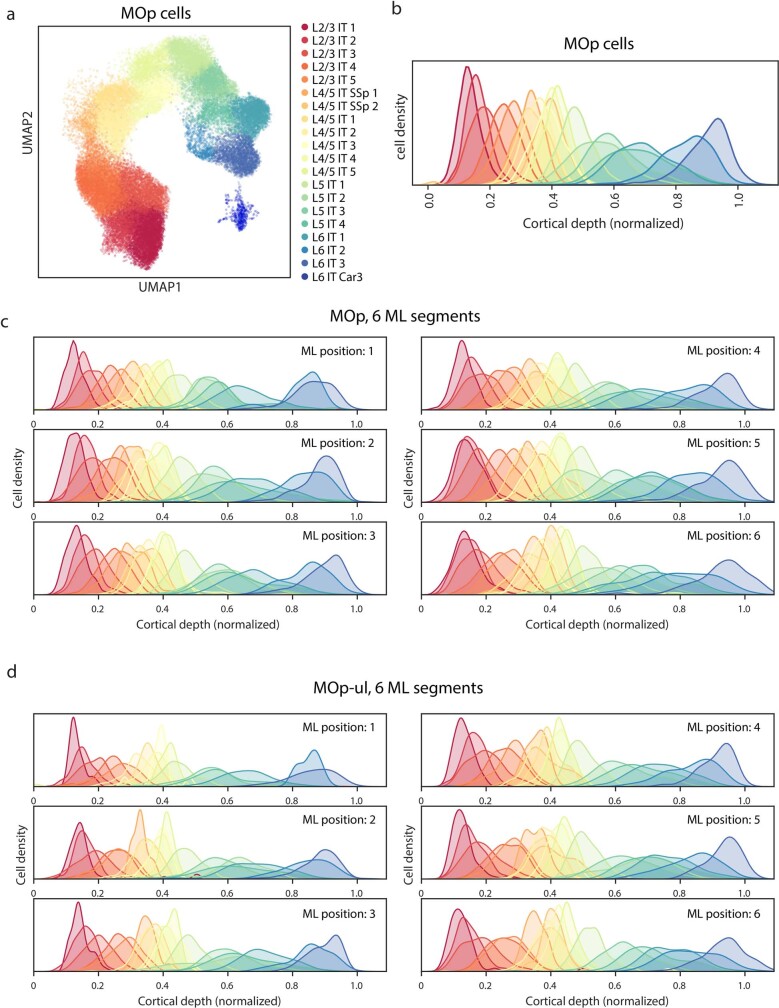
Extended Data Fig. 8. Gene expression profiles and cortical depth distributions of IT cell clusters in the MOp.
a, UMAP of the IT clusters for cells in the MOp. b, Cortical depth distributions of IT clusters in the MOp region, with individual IT clusters coloured as in a. c, Cortical depth distributions of IT clusters in different medial–lateral (ML) segments of the MOp region. The IT clusters are coloured as in a. As the variation in layer thicknesses along the ML direction could broaden the cortical depth distributions of the clusters, to assess whether the spatial overlap between different IT clusters could be caused by this effect, we divided the MOp into six segments along the ML direction, each covering a narrow ML range such that the layer-thickness variations within each ML segment are negligible. We then determined the cortical depth distributions of the IT clusters in each of the six ML segments. The spatial overlap between the IT clusters was still observed in each of the six ML segments. d, Cortical depth distributions of IT clusters in different ML segments in the approximate MOp upper limb region (between Bregma 0 and +1.0, as defined in Extended Data Fig. 3b). The spatial overlap between the IT clusters was still observed in each of the six ML segments in this region. Clusters with a low cell number (five or fewer) found in any individual ML segments are not shown.

