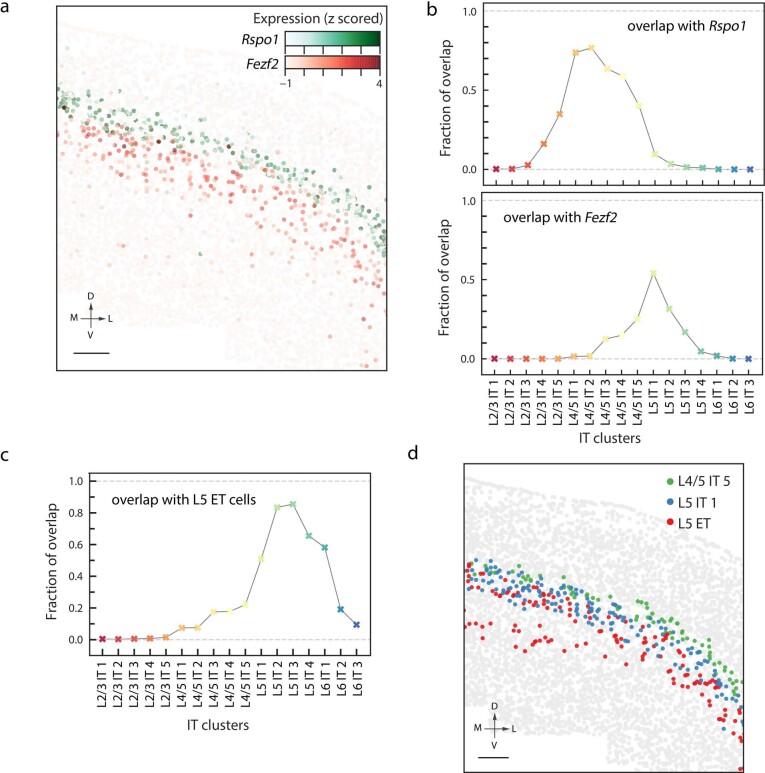
Extended Data Fig. 10. Spatial overlap between individual IT clusters and the L4 marker gene Rspo1, the L5 marker gene Fezf2 and L5 ET cells.
a, A coronal slice (Bregma approximately +1.0) highlighting the IT cells that express Rspo1 (green) and Fezf2 (red). Scale bar, 200 μm. b, Spatial overlap between individual IT clusters and Rspo1 (top) and Fezf2 (bottom). c, Spatial overlap between individual IT clusters and L5 ET cells. d, The same coronal slice as in a, but highlighting the L4/5 IT 5 (green), L5 IT 1 (blue) and L5 ET (red) cells. Scale bar, 200 μm. See Methods (‘Layer boundary assessment’ section) for how the spatial overlap is determined.

