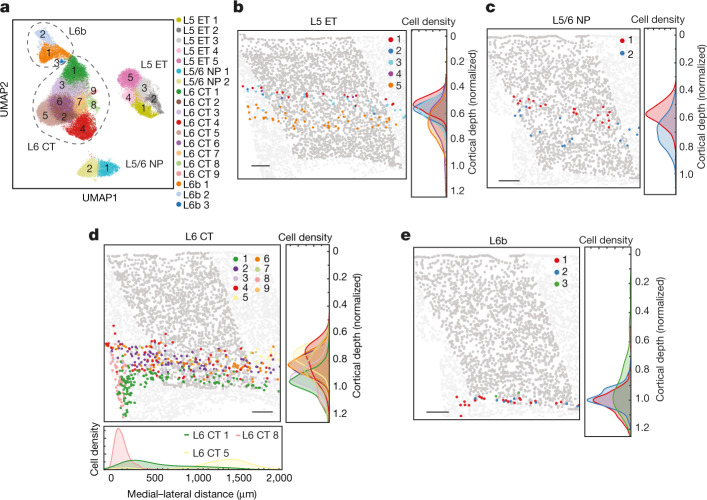
Fig. 2. Spatial organization of the L5 ET, L5/6 NP, L6 CT and L6b neurons.
a, Uniform manifold approximation and projection (UMAP) of the L5 ET, L5/6 NP, L6 CT and L6b neurons coloured by the cluster identity. b, Spatial map of L5 ET cell clusters in a coronal slice (Bregma approximately +0.8). L5 ET cells are coloured, and other cells in the MOp are shown in dark grey to highlight the MOp region, whereas other cells outside the MOp are shown in light grey. Normalized cortical depth distributions of the cells of each L5 ET cluster are shown in the right panel and presented in the form of the Kernel density of the distribution histograms. c, Spatial map of L5/6 NP cell clusters in a coronal slice (Bregma approximately +0.4) and the normalized cortical depth distributions of these clusters, as in b. d, Spatial map of the L6 CT cell clusters in a coronal slice (Bregma approximately +0.3) and the normalized cortical depth distributions of these clusters, as in b. The medial–lateral distribution for clusters 1, 5 and 8 are also shown at the bottom. The medial–lateral distribution is calculated in the coronal slices in which cluster 8 is present. e, Spatial map of the L6b clusters in a coronal slice (Bregma approximately +0.4) and the normalized cortical depth distributions of these clusters, as in b. Scale bars, 200 μm (b–e).

