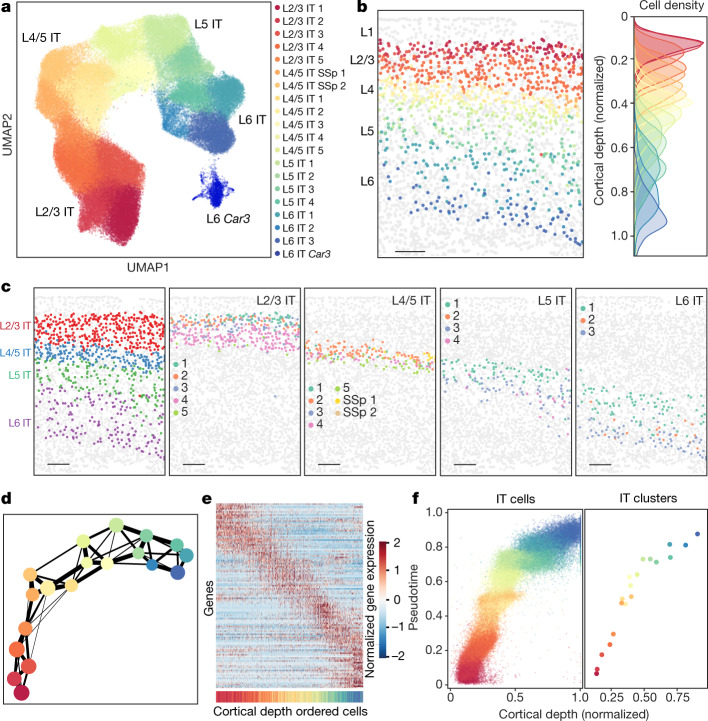
Fig. 3. Correlated gene expression and spatial gradients across IT neurons.
Analyses of IT neurons in the entire imaged region are shown here and the corresponding analyses for the MOp are shown in Extended Data Figs. 8, 9. a, UMAP of the IT clusters coloured by the cluster identity. b, Spatial map of IT neurons in a coronal slice (Bregma approximately +1.0). The IT neurons are coloured by their cluster identity as in a, and all other cells are in grey (left). Scale bar, 200 μm. The cortical depth distributions of individual IT clusters are also shown (right). c, Spatial maps of the L2/3, L4/5, L5 and L6 IT subclasses (left panel) and individual clusters in each subclass (four right panels) in the same coronal slice as in b. Scale bars, 200 μm. d, The degree of connectivity between clusters in a k-nearest neighbour graph for the IT clusters, with each cluster represented as a node coloured as in a, and the weighted edges between nodes representing their connectivity. Edges with weights below 0.1 are not shown. e, Normalized expression of differentially expressed genes of all IT neurons across cortical depth. Here, differentially expressed genes refer to genes of which the expression varied substantially with cortical depth (Methods). Individual IT neurons were sorted in the order of ascending cortical depth and the genes were sorted by the cortical depth at which they exhibit maximal expression. The coloured bar at the bottom indicates the cluster identity of the cell, coloured as in a. f, Scatter plot of the pseudotime versus normalized cortical depth for individual IT neurons (left) and individual IT clusters (right) in the L2/3, L4/5, L5 and L6 IT subclasses coloured by the cell clusters, as in a.

