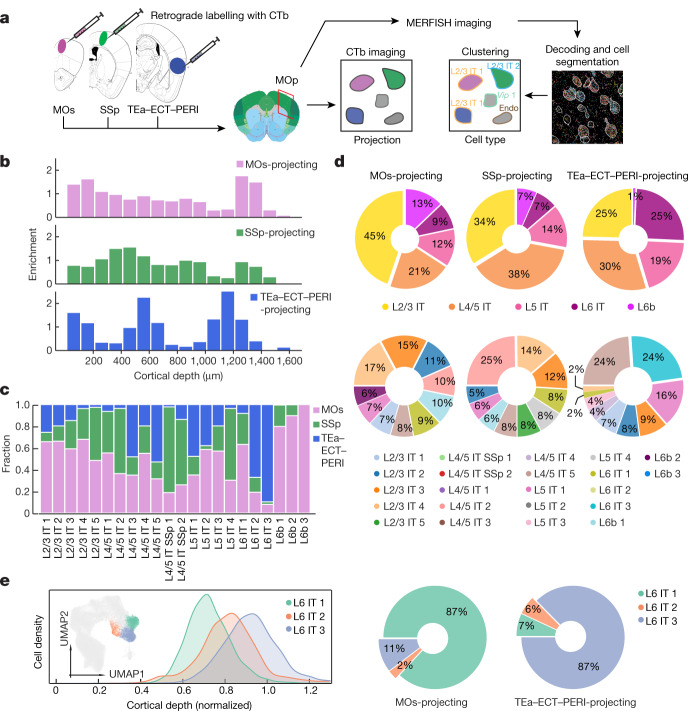
Fig. 4. Projection patterns of IT neurons determined by integration of MERFISH with retrograde labelling.
a, Workflow integrating retrograde labelling and MERFISH. CTb-AlexaFluor647, CTb-AlexaFluor555 and CTb-AlexaFluor488 were injected into the MOs, SSp and TEa–ECT–PERI regions, respectively. The coronal slices containing the MOp on the ipsilateral side of these targets were imaged for both the retrograde CTb labels and the MERFISH gene panel. The mouse brain CCF image shown on the left is from the Allen Brain Atlas (http://atlas.brain-map.org/; credit: Allen Institute). Endo, endothelial cell. b, Enrichment of MOs-projecting, SSp-projecting and TEa–ECT–PERI-projecting cells at different cortical depths. Enrichment is defined as the fraction of relevant CTb-positive cells divided by the fraction of all IT and L6b cells in the same bin. c, Fractions of MOs-projecting, SSP-projecting and TEa–ECT–PERI-projecting cells in each cell cluster among all CTb-positive, single-projecting cells in the cluster. d, Pie charts showing the proportions of MOs-projecting (left), SSp-projecting (middle) and TEa–ECT–PERI-projecting (right) cells belonging to each cell subclass (top) and cluster (bottom; only top 10 clusters shown). The mean fractions are shown and the 95% confidence intervals are less than 0.7%. e, Projection specificity of the molecularly and spatially similar L6 IT clusters. The cortical depth distributions of the L6 IT 1–3 clusters and the UMAP (inset) are displayed, with L6 IT 1–3 neurons shown in colours and other IT neurons shown in grey (left). Pie charts showing the relative proportions of MOs-projecting and TEa–ECT–PERI-projecting L6 IT neurons that belong to each of the three clusters are also displayed (right). The mean fractions are shown and the 95% confidence intervals are less than 1%.

