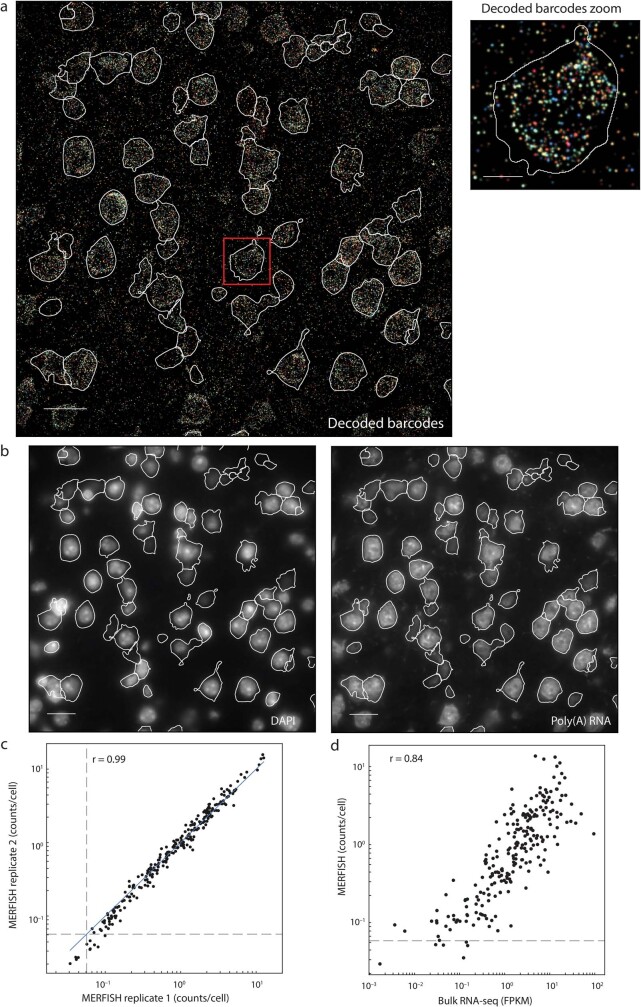
Extended Data Fig. 1. RNA identification and cell segmentation of MERFISH images, replicate reproducibility of MERFISH data, and correlation between MERFISH and bulk RNA-seq results.
a, Decoded MERFISH image of a single field-of-view, shown as a maximum intensity projection across all seven z-planes. In these experiments, we assigned 22-bit Hamming Distance 4, Hamming Weigh 4 barcodes capable of error detection and correction to individual RNA species, and the 22 bits were imaged in 11 rounds of hybridization with two-colour imaging per round. The decoded image shows all pixels that belonged to detected correct barcodes. The pixels were coloured based on their assigned barcodes and the intensity of each pixel was scaled based on the L2-norm of its signal intensity across all bits. Segmented cell boundaries are shown in white. The boxed region of the image is shown at a greater magnification (right). Scale bars, 20 μm (left) and 5 μm (right). b, DAPI (left) and poly(A) RNA (right) images for the same field of view as in a, with the central z-plane (z = 4.5 μm) shown. These images are used to define the boundaries of each cell, shown in white. Scale bars, 20 μm. a and b are representative images of more than 5,000 fields of view from two replicate animals. c, Scatterplot of the average copy number per cell of individual genes measured by MERFISH for the two replicate animals. The blue solid line indicates equality. The grey dashed lines indicate the average counts per cell of the blank barcodes (that is, valid barcodes that were not assigned to any RNA), which provides an estimate of the false-positive rate. The Pearson correlation coefficient is r = 0.99. d, Scatterplot of the average copy number per cell of individual genes determined by MERFISH versus expression level determined by bulk RNA-seq. The dashed line is as defined in c. The Pearson correlation coefficient is r = 0.84.

