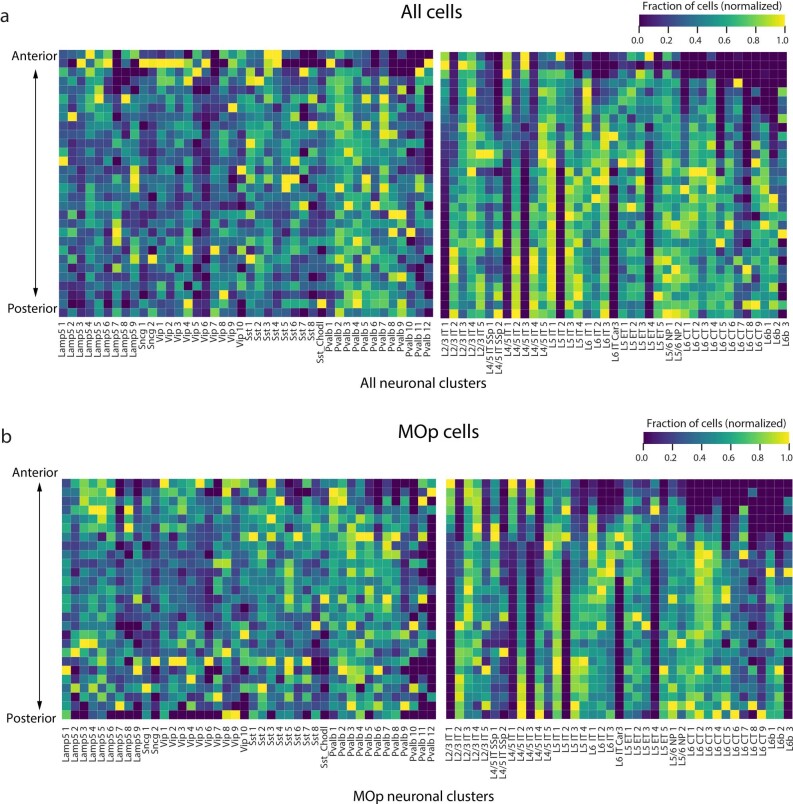
Extended Data Fig. 4. Anterior–posterior distribution of neuronal clusters.
a, Heatmap quantifying the anterior–posterior distribution of the neuronal clusters in the entire imaged region including the MOp and its adjacent areas. Slices were arranged from anterior-most to posterior-most based on their Bregma coordinates (Bregma +2.5 to −0.8). For each cluster, the fraction of cells found in each slice was determined and normalized to the maximum across all slices. b, As in a but for the neurons within the MOp.

