
Fig. 1. Delineation of the MOp-ul region and its cell-type organization.
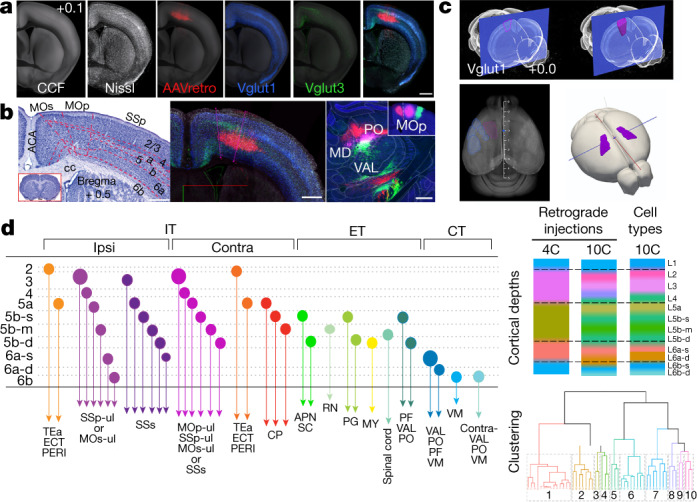
a, Brains with different anatomical labelling modalities (Nissl-stained: n = 3; AAVretro-labelled cervical spinal projecting neurons: n = 2; Cre reporter expression, n = 1 for Vglut1 and Vglut3) were co-registered in the CCF average template and viewed in Neuroglancer to facilitate delineation of MOp-ul borders. b, MOp-ul delineation based on combinatorial Nissl-stained cytoarchitecture (left) (Extended Data Fig. 2) and regional and laminar distributions of AAVretro labelling and Cre expression (middle). A triple-injection strategy was used to further validate distinctive projections of MOp-ul versus adjacent SSp-ul and MOs (right, n = 3 for each injection). AAV-RFP (red), PHAL (pink) and AAV-GFP (green) were injected into the MOs, MOp-ul and SSp, respectively (inset, right), revealing mostly non-overlapping terminal fields in the thalamic nuclei, mediodorsal nucleus (MD), CL, PCN and PO (Extended Data Fig. 5). Scale bars, 500 µm. c, The MOp-ul was rendered in 3D within the CCF. d, Left, schematic showing classification of cortical projection neuron types based on their laminar positions, projection neuron class (IT, PT and CT), and specific projection targets. Right (top), analysis of the MOp-ul layer organization by hierarchical clustering of soma depth for retrogradely labelled cells and Cre driver data (Extended Data Fig. 3). Bottom, clustering dendrogram based on MOp-ul soma depth grouped every 25 µm. ACA, anterior cingulate area; MY, medulla; RN, red nucleus.