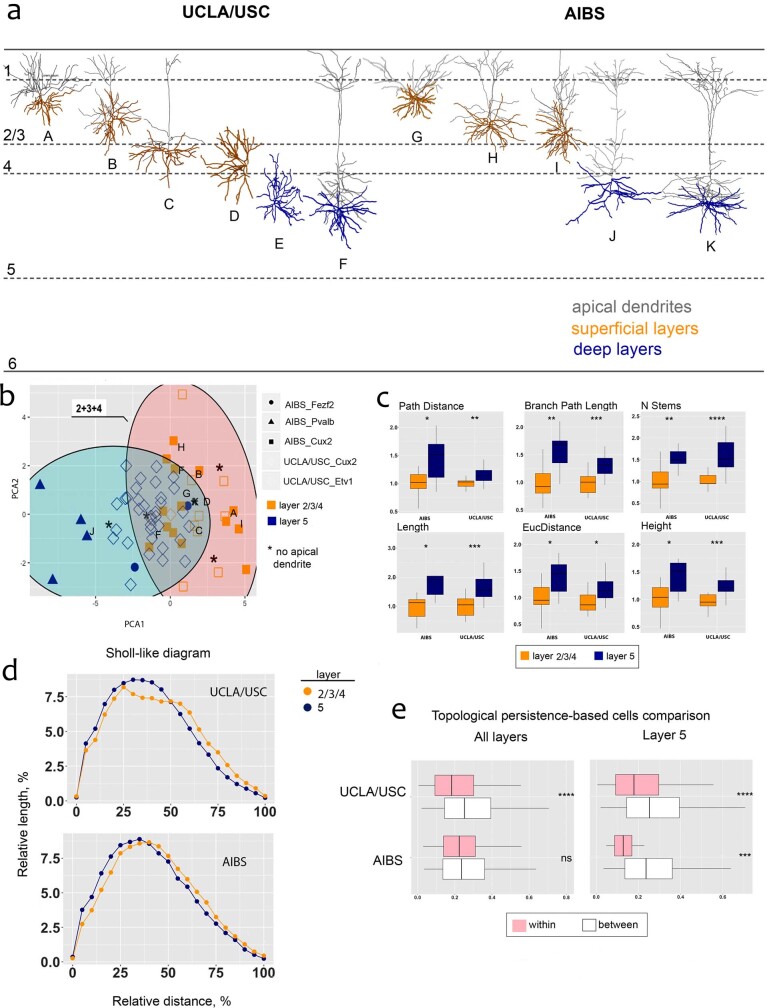
Extended Data Fig. 17. related to Fig. 3. Local morphometric features of MOp neurons across layers.
a, Examples of reconstructed cells within MOp cortical layers 2/3/4 (orange) and 5 (blue) (see Methods). Note some L4-5 Cux2/Etv1 neurons lack an apical branch. The total neurons reconstructed for each mouse strain are: MORF3 (@UCLA/USC) x Cux2-CreERT2 (n=9) or Etv1-CreERT2 (n=36); TIGRE-MORF (@AIBS) x Cux2-CreERT2 (n=16), Fezf2-CreERT2 (n=3), or Pvalb-Cre (n=4). b, Principal component analysis (PCA) shows segregation of MOp layer-specific neurons based on measured morphological features. c, Wilcoxon Signed-Rank tests were run (all parameters survived the false discovery rate correction) and group differences between layers 2/3/4 and 5 basal dendritic trees of UCLA/USC (L2-4 [n=11], L5 [n=34]) and AIBS (L2-4 [n=16], L5 [n=7]) cases separately are presented in whisker plots and the degree of their significance is indicated by stars. d, Sholl-like analysis comparing basal dendritic patterns in MOp layer 5 and layers 2/3/4 neurons. The distribution of normalized dendritic length is plotted against the relative path distance from the soma. The graph shows that dendrites of neurons within layer 5 of MOp have slightly larger dendritic length closer to the cell body compared to the dendrites of layers 2/3/4 neurons. e, Persistence-based neuronal feature vectorization was also applied to summarize pairwise differences between superficial and deep neurons for UCLA/USC and AIBS datasets independently. For whisker plots in c and e, the center line represents the median, box limits show the upper and lower quartiles and the whiskers represent the minimum and maximum values.

