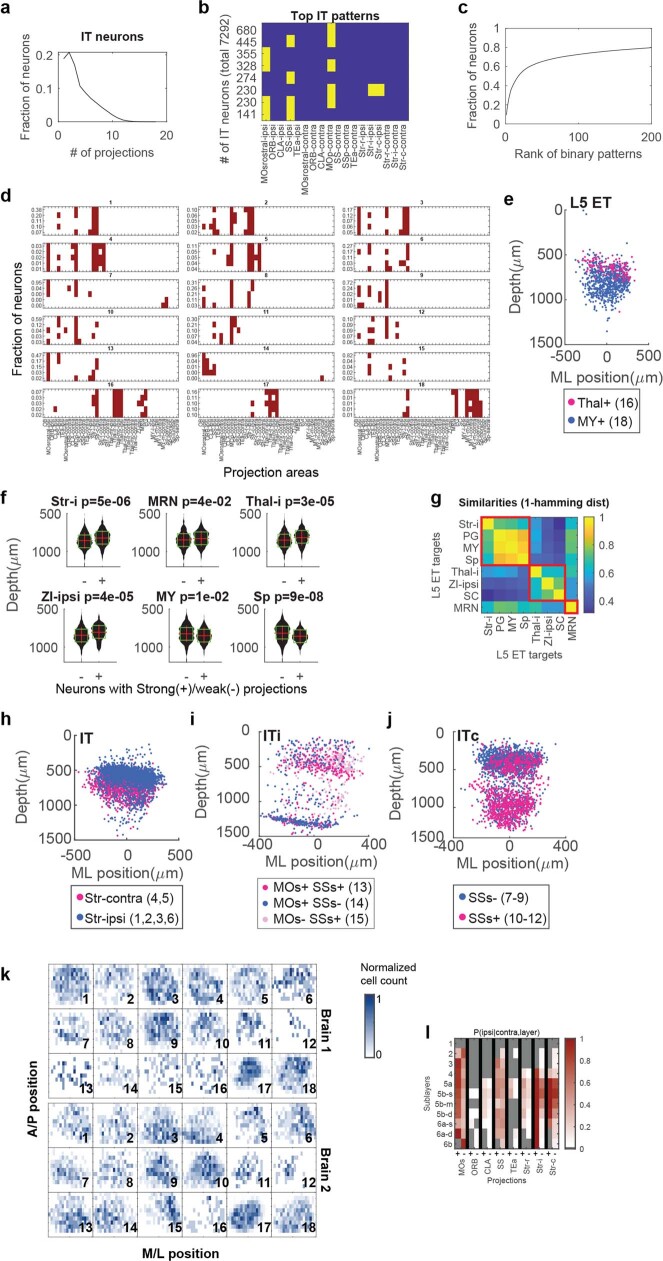
Extended Data Fig. 19. related to Fig. 4. BARseq projection mapping in MOp.
a, Distribution of projection numbers of IT neurons. b, Top binary projection patterns of IT neurons. The number of neurons with each pattern is indicated on the left. c, Cumulative fractions of IT neurons (y-axis) with the indicated number of binary projection patterns (x-axis). The projection patterns are sorted by their abundances, so the most common patterns are on the left. d, The 5 most abundant binary projection patterns in each subgroup. The fractions of neurons are indicated on the left and the subgroup numbers are indicated on top of each graph. e, Scatter plot of soma locations of the indicated subgroups in the cortex. X-axes indicate relative medial-lateral positions, and y-axes indicate laminar depth. Group numbers are shown in parentheses. Major classes to which the neurons shown belonged to are indicated above each panel. f, laminar distribution of neurons in group 18 with strong (+) or weak (-) projections to the indicated areas. P values using two-tailed rank sum tests after Bonferroni correction are shown on top of each panel. g, similarities between projection targets of L5 ET calculated. The similarity is defined as one minus the hamming distance between two areas based on their binarized co-innervation pattern across neurons of both group 16 and 18. Red squares indicate clusters identified by louvaine community detection. h, i, j, The soma locations of the indicated subgroups of neurons. X-axes indicate relative medial-lateral positions, and y-axes indicate depth. Neurons are colored by subgroups as indicated. Subgroup numbers are shown in parentheses. k, Density maps of each subgroup of neurons on the tangential plane. Neurons from the two brains are shown separately to distinguish labeling bias from real biases in distribution. The density maps are normalized so that the highest density is 1 in each plot. Subgroup numbers are indicated on each plot. l, The projection probability for the indicated ipsilateral projection (x-axis) conditioned on whether the neuron project to the same contralateral area in the indicated sublayer (y-axis).

