
Fig. 3. Brain-wide inputs to MOp-ul by layer and class.
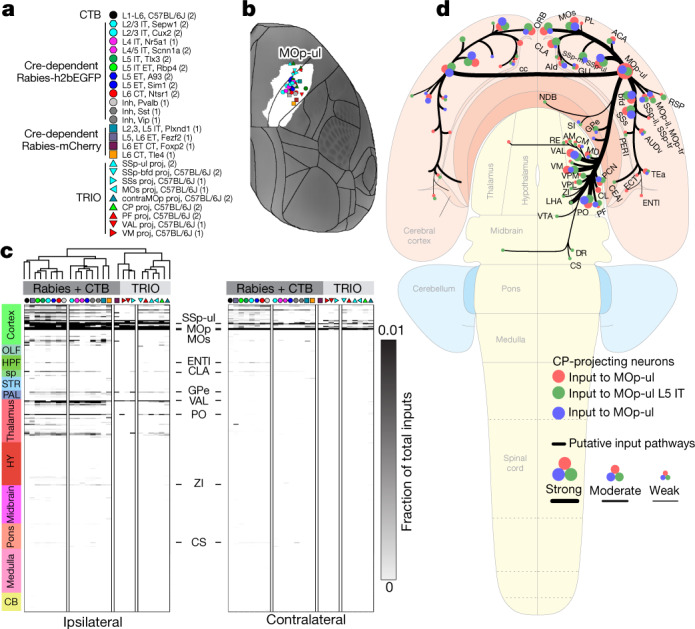
a, Key shows tracer types, mouse lines and layer and projection class selectivity for Cre driver lines used to label inputs to MOp neurons. Numbers in brackets represent the number of tracer injection experiments per type. Symbols and colour code are used in b–d. b, Injection sites are plotted on a top-down view of the right cortical hemisphere from CCFv3 with the MOp-ul delineation from Fig. 1 in white. Distance between injection sites is 622.4 ± 337.01 μm (mean ± s.d.). c, A directed, weighted connectivity matrix (26 × 628) to MOp from 314 ipsilateral and 314 contralateral targets for each of the mouse lines or tracers listed in a. Each row shows the fraction of the total input signal measured from a single experiment or the average when n > 1. Rows are ordered by major brain division. We performed hierarchical clustering with Spearman rank correlations and complete linkages, splitting the resulting dendrogram into two major clusters (rabies + CTB and TRIO experiments). A subset of input regions is indicated. The colour map ranges from 0 to 0.01 and the top of the range is truncated. d, Schematic summarizing major MOp inputs by area (red), layer (L5 IT Tlx3+ neurons, green), and target-defined projection class (CP-projecting neurons, blue) on a whole-brain flat map. The sizes of dots represent relative connectivity strength. AId, agranular insular area, dorsal part; AM, anteromedial nucleus; AUDv, ventral auditory area; bfd, barrel field; CEAl, central amygdalar nucleus, lateral part; CM, central medial nucleus of the thalamus; inh, inhibitory; LHA, lateral hypothalamic area; NDB, diagno band nucleus; proj, projecting; RSP, retrosplenial area; Ssp-bfd, primary somatosensory area, barrel field; VPL, ventral posterolateral nucleus of the thalamus.