
Fig. 5. Full morphological reconstructions reveal diverse single-cell projection motifs.
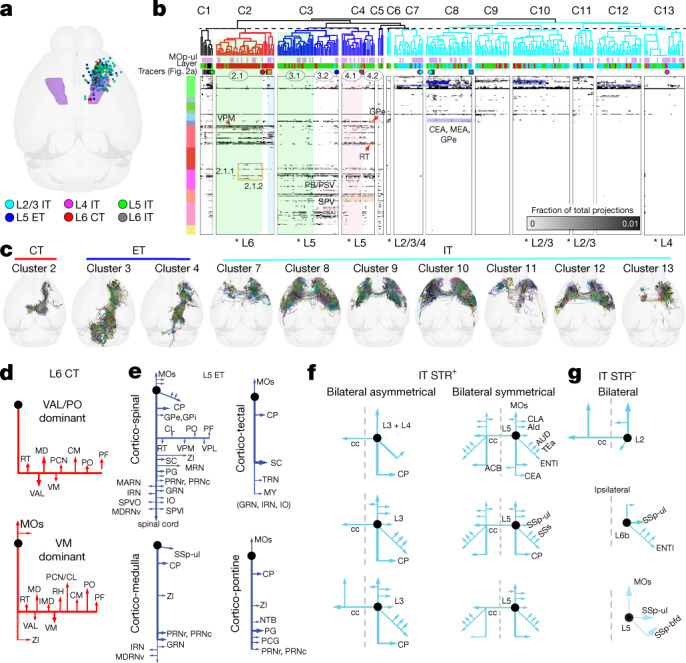
a, Soma locations (n = 303) plotted in a top-down view of CCFv3. MOp-ul delineation from Fig. 1 is shown in purple. b, Matrix showing the fraction of total axon projections from tracer (following the colour scheme from Fig. 2a) and single-cell reconstruction experiments to each of 314 targets across all major brain divisions. Columns show individual experiments. Rows show target regions ordered by major brain division. Hierarchical clustering and cutting the dendrogram as indicated with the dashed line revealed thirteen clusters. Some subclusters are indicated by the circled numbers. Cells from specific layers were significantly enriched within clusters (Fisher’s exact test, two-sided, *P < 0.05). c, Top views of all single cells and their axons assigned to cluster 2 (CT), clusters 3 and 4 (ET) and clusters 7 to 13 (IT). Cells are registered to CCFv3, rendered in 3D, overlaid, and randomly coloured (see Extended Data Fig. 20d for single-neuron morphology). d–g, Schematics of single-cell projection targets following visual inspection and classification of motifs. d, Two L6 CT patterns were identified: VAL/PO and VM-dominant projections. e, Four L5 ET motifs are shown: cortico-spinal-, cortico-medulla-, cortico-tectal- and cortico-pontine-dominant patterns. f, g, IT motifs included cells with (+) (g) or without (−) (h) projections to the striatum (STR). f, Bilateral IT motifs include asymmetrical and symmetrical projection patterns. Each schematic shows major projection targets for the cell(s) indicated. cc, corpus callosum; MEA, medial amygdalar nucleus; IMD, intermediodorsal nucleus of the thalamus; MDRNv, medullary reticular nucleus, ventral part; RH, rhomboid nucleus; SPV, spinal nucleus of the trigeminal; SPVI, spinal nucleus of trigeminal nerve, interpolar part.