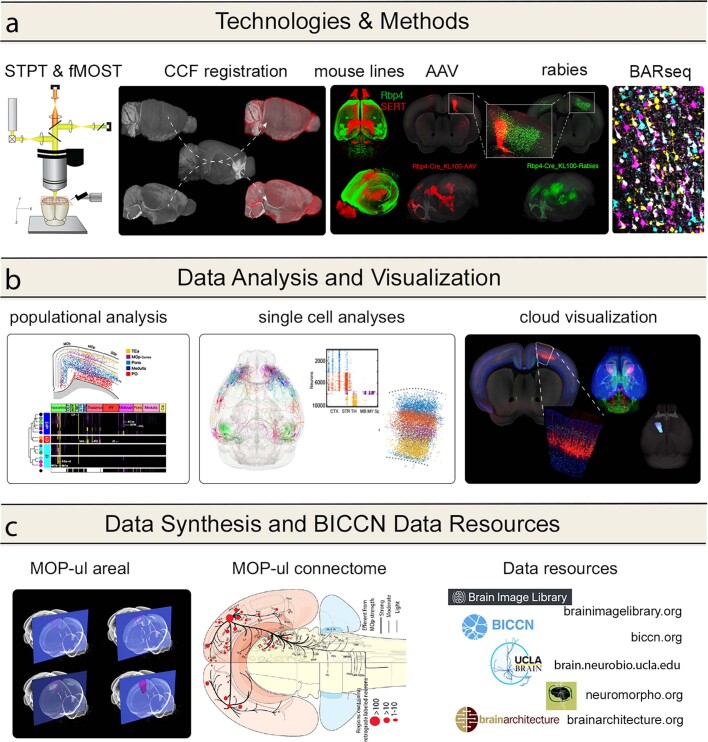
Extended Data Fig. 1. Overview of methods, analyses and resources used and generated by the BICCN anatomy group.
Related to Fig. 1. a, Whole brain image data were generated primarily by two automated microscopy methods, STPT and fMOST, and registered in the CCF. Data types include cell type distribution data used for MOp-ul regional delineations (e.g., SERT) and transgenic lines used for projection mapping (e.g., Rbp4-Cre_KL100). Outputs and inputs to MOp-ul were mapped with AAV- and rabies virus-based tracing and BARseq methods. b, Computational approaches used to analyze co-registered datasets include spatial and regional analyses of population labeling to quantitatively describe layer-specific anterograde and retrograde connections, and analyses of single cell morphology reconstructions and BARseq data to derive single neuron projection patterns. Neuroglancer was used for cloud-based data visualization and collaborative analyses of the CCF registered data at high resolution. c, The outcome of these efforts comprise a consensus-based delineation of anatomical borders of the MOp-ul, a detailed description of a cortical layer- and projection neuron type-based wiring diagram, and publicly accessible online data resources. Data and code resources are available at DOI: 10.5281/zenodo.5146390.

