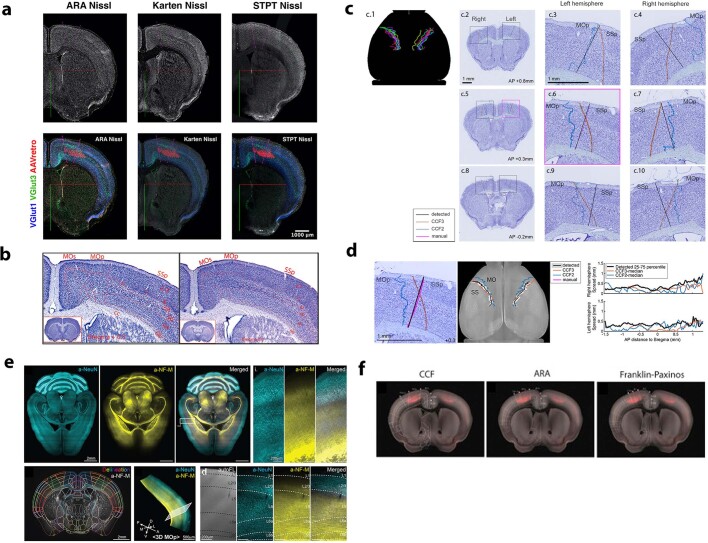
Extended Data Fig. 2. Multimodal MOp-ul delineation and validation.
Related to Fig. 1. a, Co-registration of three sets of Nissl staining and other modality data for the delineation of the MOp-ul. (Upper panel) Cloud-based visualization in Neuroglancer of a coronal plane (Bregma +0.5) of three different Nissl brains, ARA, Karten and STPT neurotrace, registered onto CCF at cellular resolution with MOp-ul annotation. (Lower panel) MOp-ul detail of the previous brains overlay to the same markers shown in Fig. 1: Vglut1 and Vglut3 Cre-dependent markers, as well as AAVretro labeled cervical spinal cord projecting neurons. b, Delineations of the MOp based on Nissl-stained cytoarchitecture. The MOp and its adjacent SSp and MOs were delineated based on their areal and laminar cytoarchitectonic properties. The SSp is identifiable with a clearly visible “granular” L4 (gr) consisting of small densely packed somas, which becomes thinner and less granulated (dysgranular or dg) towards its medial tip adjacent to the MOp. Contrary to a general belief that MOp is agranular, we observed a visible thin layer of granular cells that is continued from SSp throughout the MOp. Finally, we identified a transitional junction in L2/3 which was much thinner in MOp than in SSp. Digital images of Nissl-stained histological sections were a gift from Dr. Harvey Karten (http://brainmaps.org/index.php?action=viewslides&datid=43). Manual annotation conducted by Dr. Hong-Wei Dong. c, MOp-SSp boundary algorithmically detection based on Nissl cell textures in 10 brains mapped to the CCF with the borders mapped from CCFv3 (red lines) and CCFv2 (blue lines). c.1, Nissl-based MOp-SSp boundary (at the dorsal surface of the cortex) in 10 brains co-registered to CCF. Each set of bilateral borders with the same color was extracted from one brain. c.2, A sample Nissl stained section around AP +0.8mm. c.3, A magnified view of the region in left hemisphere shown in c.2. c.4, A magnified view of the region in right hemisphere shown in c.2. c.5-c.7, Borders for a section around AP +0.3mm. c.6, In the left hemisphere of the section shown in c.5, an expert-determined MOp-SSp border was denoted in magenta. c.8-c.10. Borders for a section around AP −0.2mm. d, Left: Algorithmically determined boundary (black), and expert manual annotation of the MOp-SSp border (magenta) are shown together with boundaries of reference atlases registered to an individual brain (CCFv2: blue, CCFv3: red). Middle: Results of the algorithmic detection mapped to the CCF. The black lines show the median of the detected MOp-SSp boundaries with 25-75 percentile limits shown in gray. Right: The 25-75 percentile spread as a measure of dispersion (black lines) plotted together with the distances between the reference atlases and the median line (see panel c). e, (Upper panel) Lightsheet microscopic images of 3D whole brain histology. 3D delineation of the MOp layer borders based on whole brain immunostaining with a-NeuN and a-Neurofilament-M (NF-M) using SHIELD-eFLASH. An optical section (left) and zoom-in view (right). (Lower panel) An optical section of the entire brain is shown and 3D rendering of MOp (A, anterior; P, posterior; D, dorsal; V, ventral; M, medial; L, lateral); (Right) The cortical layer borders of MOp delineated based on autofluorescence (black dotted lines) and immunofluorescence (white dotted lines). f, Allen CCF labels, Allen Reference Atlas (ARA) labels, Franklin-Paxinos labels established in the Allen CCF background images. Red signals are from retroAAV-Cre injection in spinal cord registered in the CCF. See details in Supplementary Information for integration of labels from existing atlases onto the Allen CCF. Acronyms defined in Supplementary Table 1.

