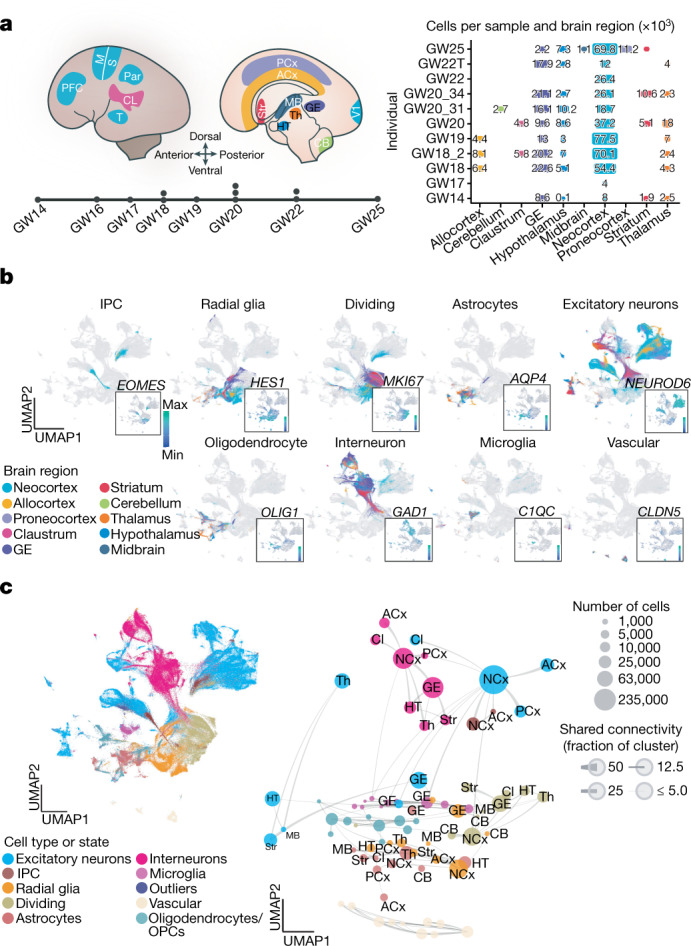
Fig. 1. Single-cell analysis of gene-expression signatures across regions of the developing human brain.

a, Left, schematic showing the anatomical brain regions sampled for this study. The timeline below highlights the number of individuals sampled at each gestational week. Right, matrix showing the final count (after quality control) of cells from each individual distributed across regions sampled. b, Single cells from all brain regions sampled are represented in UMAP space. Cells are colour-coded by their region of origin. Insets show the expression profile of canonical genes representative of each identity. c, Top left, distribution of cell types and states in UMAP space. Constellation plot of cells grouped by type or state and brain region highlights the interplay between cell type (node colour) and regional identity (node label). Nodes are scaled proportionally to the number of cells in each group. Edge thickness at each end represents the fraction of cells within a group with neighbours in the opposite group. Node colour corresponds to cell type or state; node label corresponds to the brain region from which cells were sampled. ACx, allocortex; CB, cerebellum; CL, claustrum; GE, ganglionic eminences; HT, hypothalamus; M, motor cortex; MB, midbrain; NCx, neocortex; Par, parietal cortex; PCx, proneocortex; S, somatosensory cortex; Str, striatum; T, temporal lobe; Th, thalamus.
