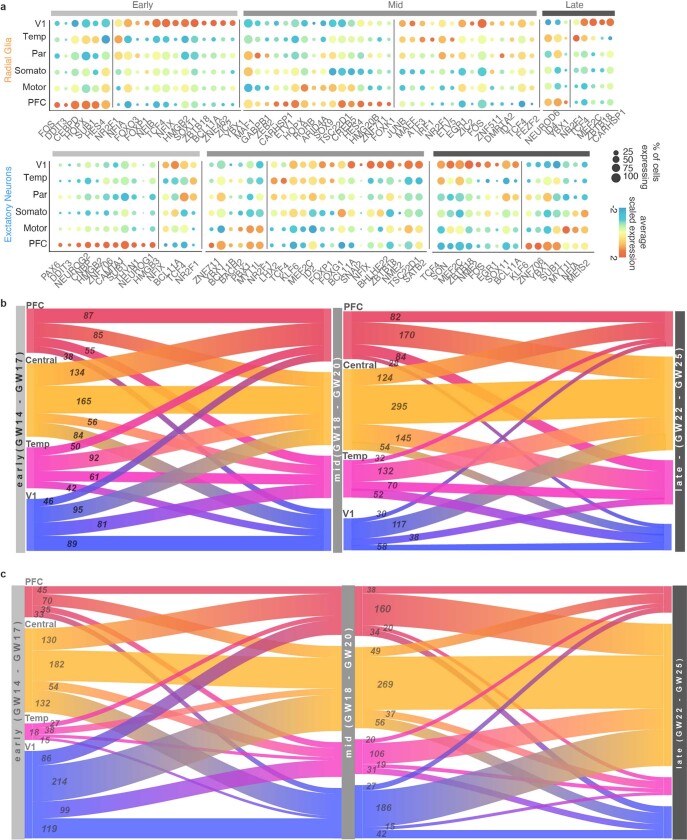
Extended Data Fig. 6. Gene-Expression Dynamics Across Areas and Developmental Stages.
a, Dot plots transcription factors enriched across areas in radial glia (left) and excitatory neurons (right) relative to other cortical areas. Enrichment can occur via an increase in the number of cells expressing a given gene, an increase in the average expression level of expressing cells, or both. b, Sankey plots show the proportion of area-specific excitatory neuron genes shared across developmental stages. The number on each block line indicates how many genes are represented by that stream as the stream sizes are not to scale. The “central” area encompasses motor, parietal, and somatosensory areas. c, Sankey plots show the proportion of area-specific radial glia genes shared across developmental stages. The number on each block line indicates how many genes are represented by that stream as the stream sizes are not to scale.

