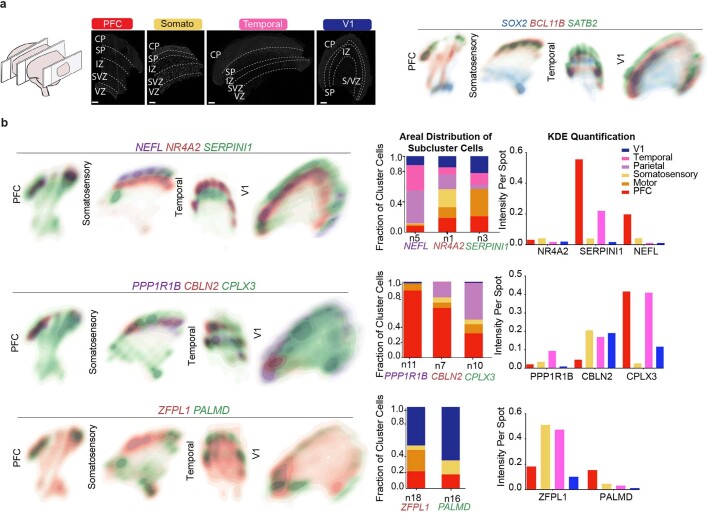
Extended Data Fig. 11. Spatial analysis of GW16 sample.
a) Top left: Nucleus staining outlines tissue architecture, with the ventricular zone at the bottom and the cortical plate at the top. Top right: KDE plots of positive control genes. SOX2 marks radial glia and the ventricular zone, while SATB2 and BCL11B mark the cortical plate. As previously described, SATB2 and BCL11B are co-expressed in frontal regions, but are mutually exclusive in occipital regions. Scale bar = 444 μm. This analysis was performed once for each of the four regions. b) KDE plots of neuronal genes of interest. Genes were chosen as candidate markers for specific neuronal subclusters. Clusters being explored are named below the histogram each gene marker for this cluster is below its name. Stacked histograms show the expected ratio of clusters as a fraction of total composition. To the far right in each row, the quantification of the KDE plots is shown as intensity divided by the number of spots in order to reflect both the intensity of signal but also the pervasiveness of the marker to not artificially bias the analysis by examples of rare but intense signal. We see strong correspondence between the predicted spatial distribution of clusters and the signal in our spatial RNA analysis.

