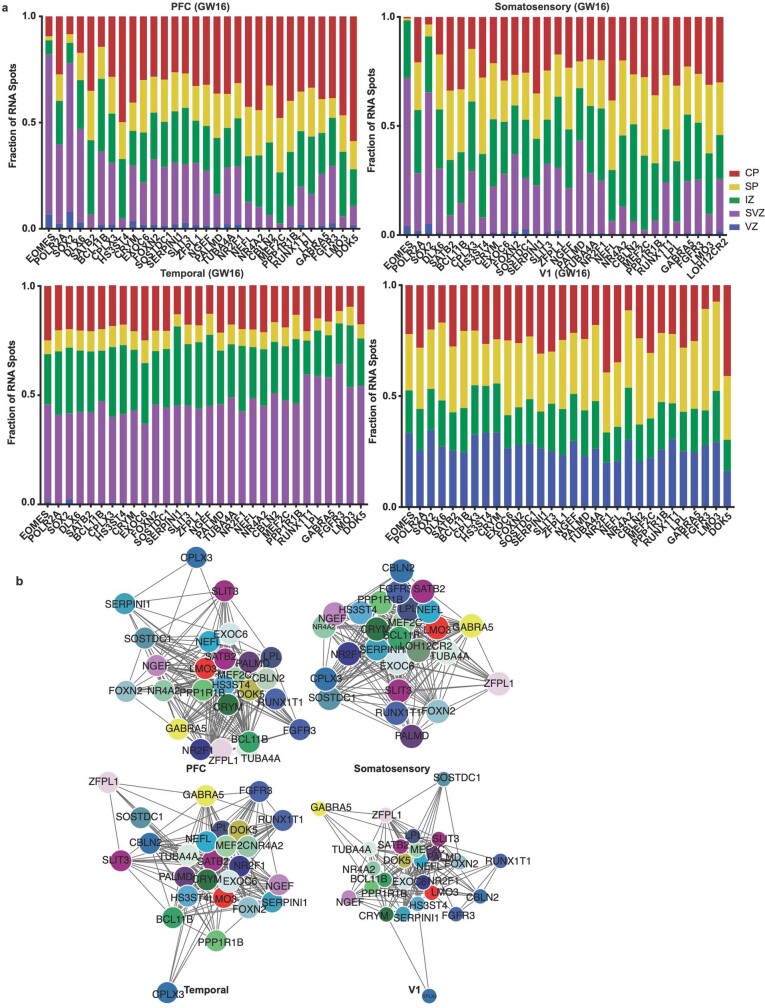
Extended Data Fig. 14. Laminar and network changes across cortical areas (GW16).
a) We quantified the laminar distributions of each gene in each GW16 sample. The distributions are shown by laminar region, as annotated in Fig. 4, and are represented as fraction of signal for each gene in each bin. b) Using cell identities for individual gene spots, we computed co-expression networks for each sample to visualize changes in the co-expression patterns of the 31 genes analyzed across areas of the cortex. Gene pairs were classified as coexpressed if their Pearson correlation was >=0.05. Networks are shown in a force-directed layout reflective of interaction strength. Only neuronal marker genes are shown, colored as in panel (b).

