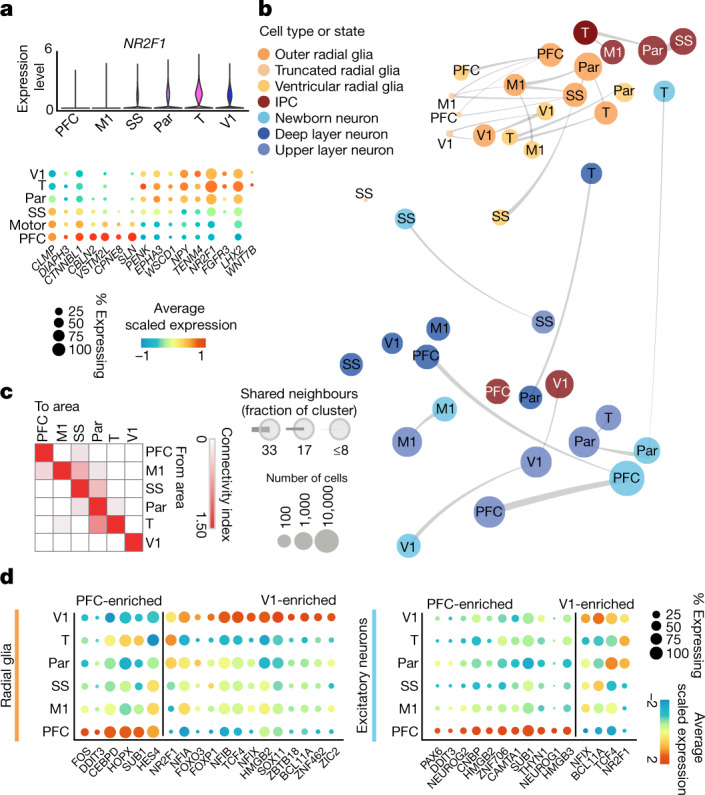
Fig. 3. Cortical area-specific gene signatures.

a, Top, violin plots show the expression of the previously described posterior-high to anterior-low gradient marker gene NR2F1 across all neocortical cells grouped by area. Bottom, dot plot shows the expression of a representative panel of previously reported areally enriched genes across all neocortical cells grouped by area. Expression profiles validate the areal identity of the cortical subdissections used in this study. b, Constellation plots of excitatory lineage grouped by cortical area and annotated by cell subtype highlight cascading differences in areal identity, with similarities between cell types from the same region. Each dot is scaled proportionally to the number of cells represented by that analysis. The thickness of the connecting line on each end represents the fraction of cells within each group with neighbours in connected groups. Dot colour represents cell type and text over the dot marks cortical area. c, Quantification of the constellation plots, with ‘towards area’ in columns and ‘from area’ in rows. The connectivity index from white to red integrates the number of connections between two cell types as well as the average fraction of cells from each cluster contributing to each connection. d, Dot plots quantify a subset of transcription factors enriched in PFC or V1 radial glia (left) and excitatory neurons (right) relative to other cortical areas. Enrichment can occur through an increase in the number of cells expressing a given gene, an increase in the average expression level of expressing cells, or both. Cortical areas: M1, motor; Par, parietal; SS, somatosensory; T, temporal; V1, visual.
