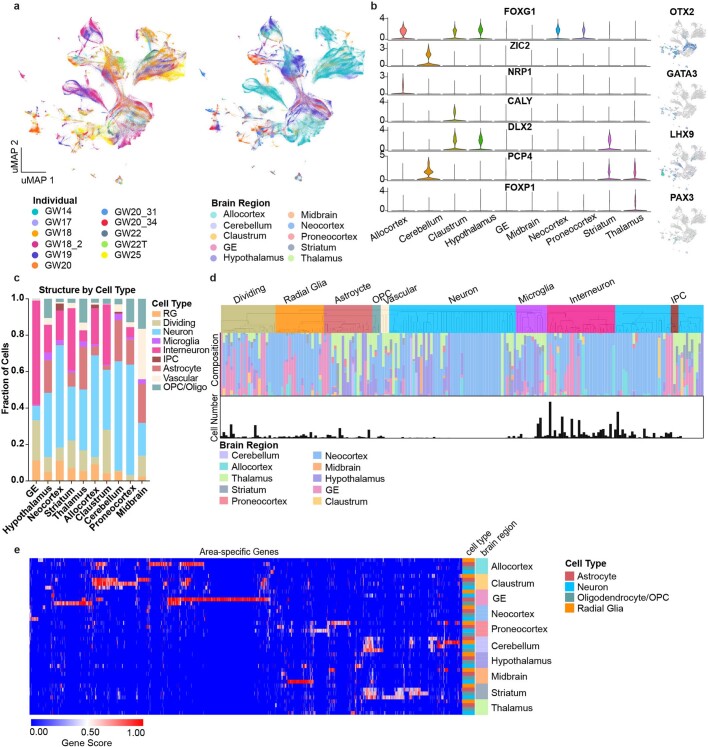
Extended Data Fig. 1. Single-cell analysis across the whole developing human brain.
a, UMAP plots showing the representation of samples by individual and brain region. There is strong intermixing across individuals, but more segregation by stage. b, On the left, violin plots of known and novel brain region-enriched marker genes. On the right are feature plots of cell type specific transcription factors. c, Histogram depicting the cell type composition as determined by the single-cell analysis for each sampled brain region, showing similar distributions across regions, but with known enrichments for inhibitory interneurons in the ganglionic eminences, and other small enrichments for specific cell types in other regions. d, Hierarchical clustering of 210 neocortex clusters based upon Pearson correlations across cluster markers. Each bar is colored based upon the major cell type assigned to that cluster. Beneath the clusters are histograms showing the fraction of cells from each area contributing to the cluster, and below that is a barchart showing the relative number of cells in each cluster (log2 transformed numbers ranging from 0 to 20). e, Heatmap representing the universe of area-specific genes for each cell type. Gene score, a metric that combines specificity and fold change, is shown from blue to red. Rows are grouped by brain region, and reveal that in many structures, area-specific genes cross cell types.

