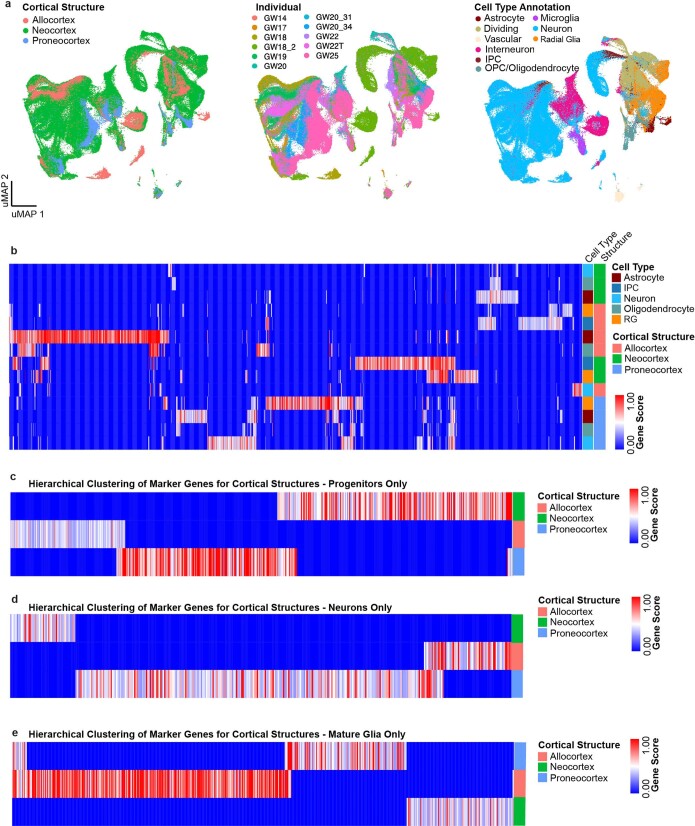
Extended Data Fig. 2. Single-cell analysis of regional identities across distinct cortical structures.
a, UMAP projection of neocortex, allocortex and proneocortex cells alone, using cell type annotations from the previous analysis. Left UMAP plot shows integration of neocortex and allocortex cells (green and salmon, respectively), but exclusion of proneocortex cells (blue). In the middle UMAP plot, cells are colored by individual. Right UMAP plot shows the distribution and strong segregation by cell type. b, Marker genes (columns) specific to distinct cortical regions by cell type. Rows and columns are hierarchically clustered columns using one minus Pearson correlation for the distance metric. Heatmap reflects strong regional transcriptional identities, even among these 3 cortical structures. Additionally, it highlights expression signatures that cross cell type boundaries. c, Marker genes (columns) specific to distinct cortical regions analyzed in progenitors only. Rows and columns are hierarchically clustered columns using one minus Pearson correlation for the distance metric. d, Marker genes (columns) specific to distinct cortical regions analyzed in excitatory neurons only. Rows and columns are hierarchically clustered columns using one minus Pearson correlation for the distance metric. e, Marker genes (columns) specific to distinct cortical regions analyzed in mature glia only. Rows and columns are hierarchically clustered columns using one minus Pearson correlation for the distance metric.

