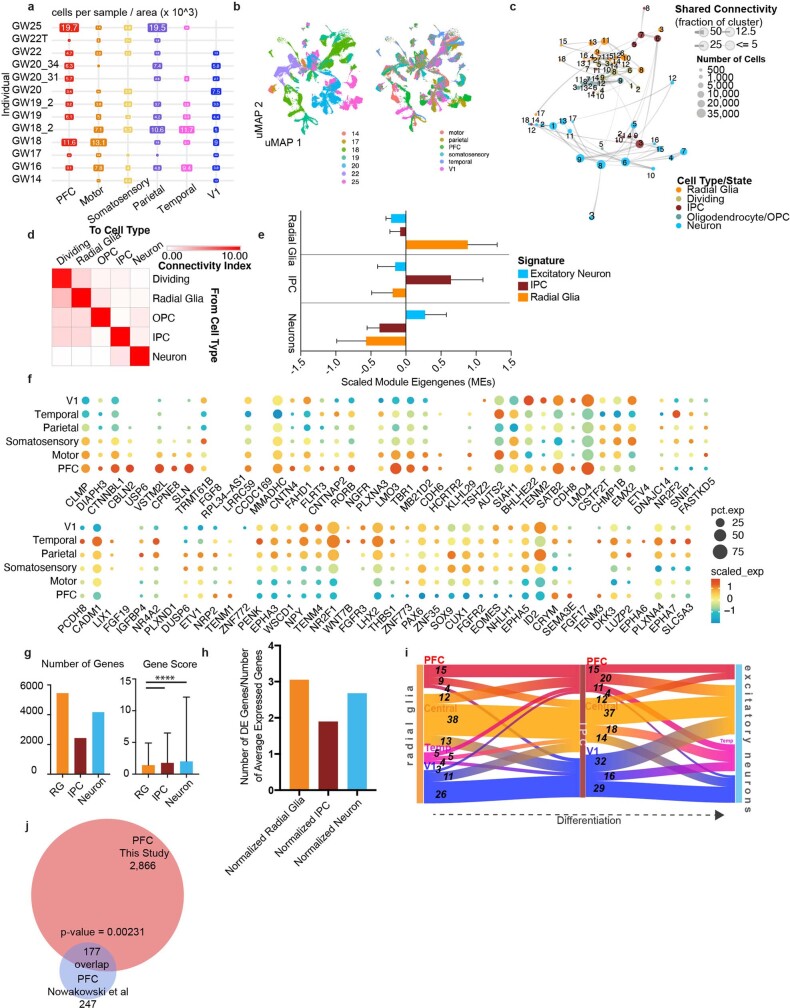
Extended Data Fig. 3. Single-cell analysis across the developing human neocortex.
a, Matrix showing the distribution of the number of cells across areal dissections for each of the individuals samples. Number of cells is shown in boxes sized proportionally to the number of cells from that individual and region, times 1000. b, UMAP plots showing the representation of samples by age (GW) (left) and brain region (right). There is strong intermixing across individuals, but more segregation by stage. c, Constellation plot shows the relationships between clusters of the excitatory lineage and oligodendrocytes, highlighting the strong relationships between clusters of the same cell type and lineage, but not between those of different groups. Nodes are scaled proportionally to the number of cells in each group. Edge thickness at each end represents the fraction of cells within a group with neighbors in the opposing group. Nodes are colored by cell type/state, and labelled by the brain region from which cells were sampled. d, Constellation plot quantification, with ‘towards cell type’ connectivity as columns and ‘from cell type’ connectivity as rows. The connectivity index integrates the number of connections between two distinct cell types, as well as the average fraction of contributing cells from each cluster. e, Differential expression was performed at the cell type level between radial glia, IPCs, and excitatory neurons. Each set of cell-type-enriched genes was used to create a network and scaled module eigengenes were calculated for each cell type. n = 50,000 cells subsampled from full dataset. Mean with standard deviation error bars are shown. f, Dot plot of area-specific genes as identified in Cadwell, et al 2019 as they are expressed in our dataset. Most genes show expected expression patterns, though some deviate from these expectations, likely because many of these genes have been characterized in the rodent. g, Quantification of the number of differentially expressed areal genes from each cell type, using a union of all genes as calculated across each individual in the dataset. The gene score, an integration of fold change and specificity is quantified in the lower graph, with mean plus standard deviation shown. Neurons vs radial glia p-value = 0.000011; IPC vs radial glia p-value = 0.000435 (one-sided t-test). For both analyses, n= 5446 (radial glia), 2426 (IPCs), 4170 (Neurons). h, Quantification of the number of differentially expressed areal genes from each cell type, using a union of all genes as calculated across each individual in the dataset normalized by the average number of genes expressed within that cell type. i, Sankey plots show the proportion of area-specific gene groups shared between cell types and cortical areas. The number on each block line indicates how many genes are represented by that stream as the stream sizes are not to scale. The “central” area encompasses motor, parietal, and somatosensory areas. j, Venn diagram showing the overlap between the PFC/V1 genes in the Nowakowski, et al 2017 dataset and this study. p-value = 0.00231, Chi-square test.

