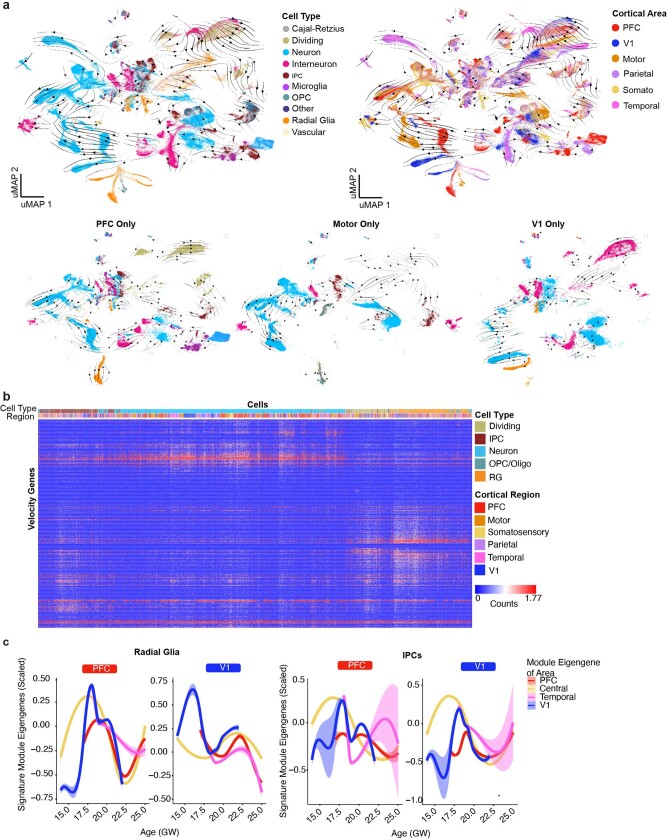
Extended Data Fig. 5. Trajectories of differentiation and changes in gene signatures.
a, RNA velocity analysis was performed using all necortical cells from the dataset. Stream arrows depict predicted differentiation trajectories. Cells are shown in UMAP space, and are colored by cell type (left panel) and by cortical area (right panel). In the second row, zoomed in streams are shown for individual cortical areas PFC, motor and V1 only colored by cell type. b, Normalized counts for area-specific genes (rows) that were detected by the RNA-velocity algorithm are shown across a random subset of 20,000 cells (columns). Rows and columns were hierarchically clustered using a one minus pearson correlation distance matrix. Cell type and region are shown for each cell (top color bar), and highlight cortical area specific excitatory neuron populations. c, Module eigengenes were calculated for radial glia (left) and IPCs (right) based upon the area specific gene signatures identified in neurons of that area. For both sets of plots, the gene-expression signature of PFC neurons is shown on the left and the V1 signature is shown on the right. Lines indicate the signature strength for progenitors of each region across the timepoints sampled. Early in development, PFC radial glia are defined by a low V1 signature strength, while V1 radial glia are defined by a strong V1 signature and minimal signal for all other areal signatures. IPCs from the PFC and V1 are generally defined by the lack of a strong signature for any of the areas calculated. Range shows 95% confidence interval.

