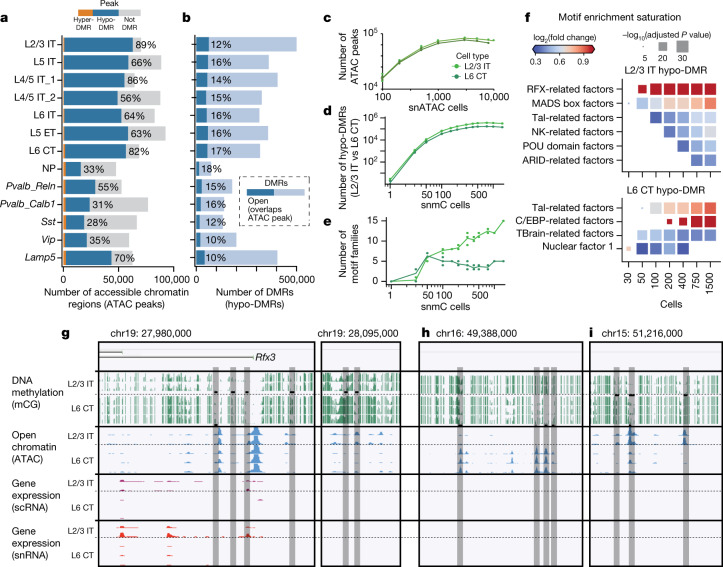
Fig. 3. Epigenomic signatures of regulatory elements in the MOp.
a, b, Regulatory regions were identified in each cell type using DMRs (n = 1,302,403) (a) and open chromatin regions (ATAC peaks; n = 316,788) (b) in multimodal integrated clusters. c, d, Saturation analysis for two excitatory subclasses shows the number of regulatory regions detected as a function of sampled cells. e, Saturation analysis of the number of transcription factor DNA-binding sequence motifs enriched in DMRs of each cell type. f, Enrichment of motifs for selected transcription factor families as a function of the number of cells sampled. g, Browser views of loci containing cell-type-specific regulatory elements (grey highlighted regions). The Rfx3 gene is differentially expressed in L2/3 neurons and has an enhancer specific to L2/3 located approximately 15 kb upstream of the promoter region. h, i, Examples of intergenic regions with accessibility and demethylation specific to L6 CT (h) or L2/3 (i) neurons. The black bars indicate predicted regulatory regions.

