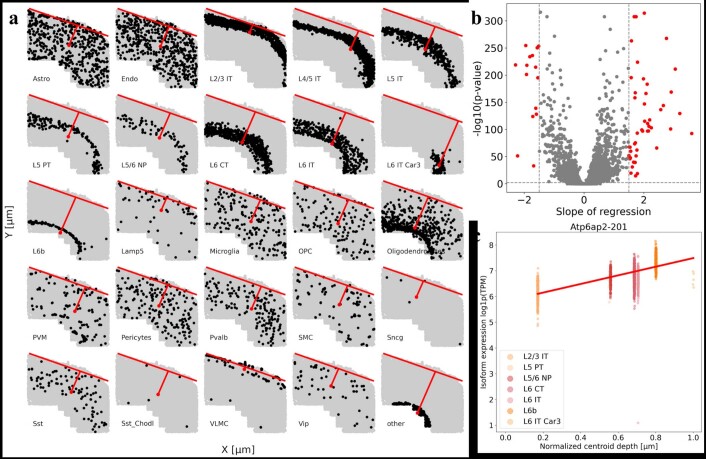
Extended Data Fig. 7. Analysis of isoform expression gradients.
a) A representative slice of the mouse primary motor cortex, as assayed by MERFISH, where each dot indicates the position of a cell from the corresponding subclass (black). The red points indicates the position of the centroids of those cells within the colored subclass with a line connecting the centroids to the boundaries of the brain slices; the distance from the centroid to the slice boundary is indicated by the red line. b) Volcano plot of the set of isoforms found to be differentially expressed across the depth of the mouse primary motor cortex found using weighted least squares regression. The isoforms with a bonferroni corrected p-value less than 0.01 and regression slope greater than 1.5 are colored red. c) An example of an isoform that is colored red in plot (b). The expression of Tubb2a-201 appears to increase across the depth of the motor cortex on average.

