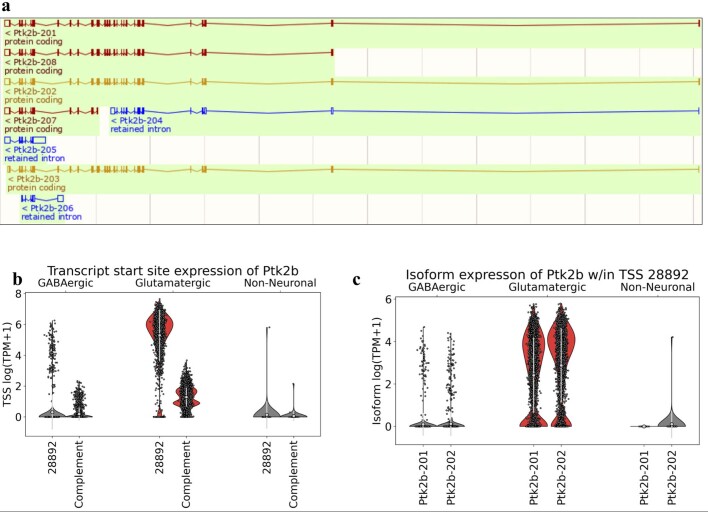
Extended Data Fig. 8. Isoform shifts reflecting transcriptional changes.
a) The eight isoforms of the Ptk2b gene. The 1st and 3rd isoforms from the top have the same transcription start site at the 5′ end of the transcript. b) Expression patterns of groups of transcript sharing the same transcript start site (TSS) from the protein tyrosine kinase 2 (Ptk2b) gene. c) Expression patterns of isoforms within TSS groups from the Ptk2b gene. The white circles within the violin plots represent the mean and the white bars represent ±one standard deviation.

