
Fig. 2. Isoform specificity in the absence of gene specificity.
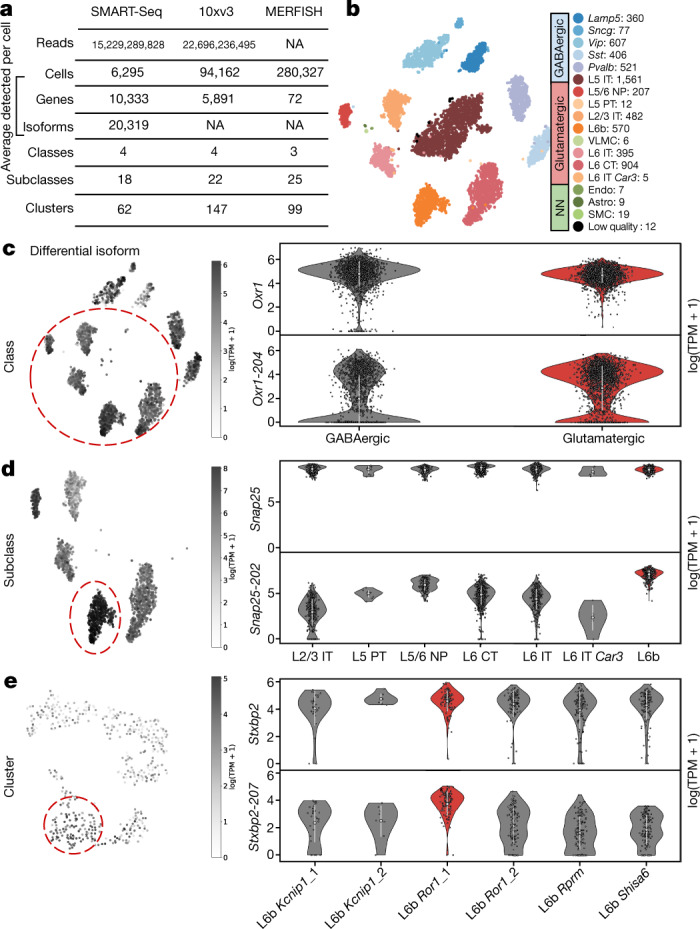
a, Overview of the data analysed. The clustering method used by the BICCN consortium generates three hierarchies of cells: classes, subclasses and clusters. NA, not applicable. b, A t-SNE of 10 neighbourhood components of 6,160 SMART-seq cells coloured according to subclass. Astro, astrocytes; CT, corticothalamic; endo, endothelial; IT, intratelencephalic; NN, non-neuronal; NP, near-projecting; PT, pyramidal tract; SMC, smooth muscle cells; VLMC, vascular lepotomeningeal cells. c, Example of a gene with an isoform specific to the glutamatergic class. The Oxr1-204 isoform distribution in log1p(transcripts per million (TPM)) across cells (left) superimposed on the t-SNE of the cells. The cells belonging to the glutamatergic class are circled. The violin plots of the gene and isoform distributions show that the gene is not differentially expressed but the isoform is (right). d, Example of a gene with an isoform specific to the L6b subclass. The Snap25-202 isoform distribution across cells (left) superimposed on the t-SNE of the cells. The cells belonging to the L6b subclass are circled. The violin plots of the gene and isoform distributions show that the gene is not differentially expressed but the isoform is (right). e, Example of a gene with an isoform specific to the L6b Ror1_1 cluster. The Stxbp2-207 isoform distribution in log1p(TPM) across cells (left) superimposed on the t-SNE of the cells. The cells belonging to the L6b Ror1_1 cluster are circled. The violin plots of the gene and isoform distributions show that the gene is not differentially expressed but the isoform is (right). *P < 0.01 between the group and its complement. In violin plots, white circles represent the mean and white bars represent the s.d.