
Fig. 3. Isoform atlas.
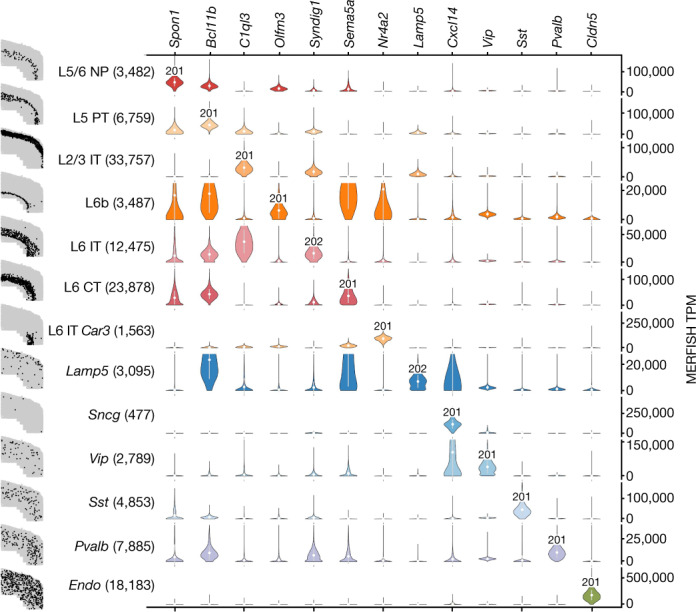
Spatial isoform atlas of the MOp. The scatter plots (left) show the locations of cells (black dots) in the indicated subclass within a single representative slice of the mouse MOp as assayed by MERFISH. Right, each column corresponds to a marker gene in the MERFISH dataset and each row corresponds to a subclass (number of cells in parentheses) in which one isoform (labelled on the diagonal) was differential in the SMART-seq dataset for that subclass. This spatial isoform inference links isoform expression from the SMART-seq data with the physical locations of cells expressing that isoform from the MERFISH data. The normalized gene expression values are plotted for each subclass–gene pair in TPM. The white circles in the violin plots represent the mean and the white bars represent the s.d.