
Fig. 4. Spatial extrapolation of isoform expression.
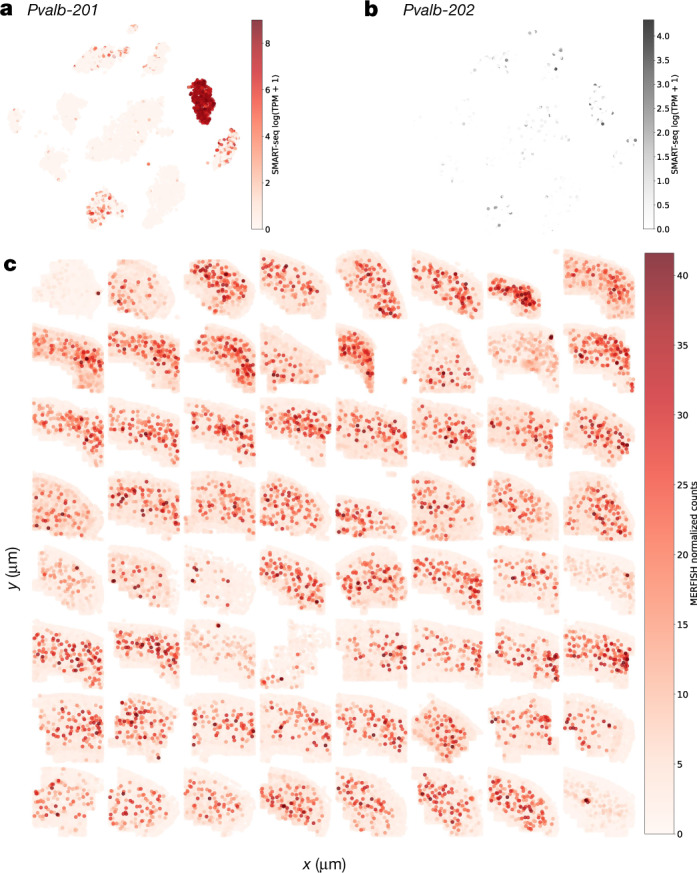
a, b, Expression of the Pvalb-201 (a) and Pvalb-202 (b) isoforms in log1p(TPM) units for each cell superimposed on the NCA–t-SNE plot, as assayed by SMART-seq. c, Spatial expression of the Pvalb-201 isoform across 64 slices from the MOp, as extrapolated from probes for the Pvalb gene assayed by MERFISH. Each cell represented by MERFISH data is coloured by its expression of Pvalb in normalized counts.