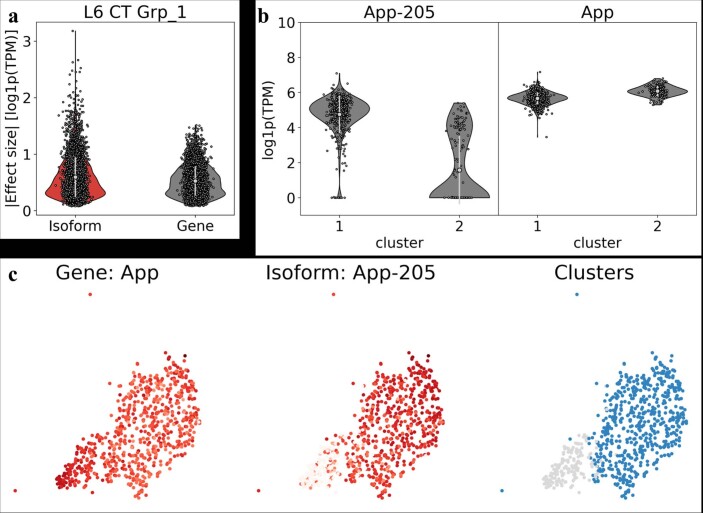
Extended Data Fig. 5. Splitting clusters with k-means clustering on isoforms.
a) Effect sizes for isoforms that split the L6 CT Grp_1 cluster into two parts is higher on average than that for genes. b) The App-205 isoform splits the L6 CT Grp_1 cluster into two parts where one part has a higher expression of the isoform whereas both halves have similar App gene expression. The white circles within the violin plots represent the mean and the white bars represent ±one standard deviation. c) Each point is a cell and is painted by the log1p(TPM) expression of the App gene (left) and App-205 isoform (middle). K-means clustering splits the L6 CT Grp_1 cluster into two distinct halves marked by expression of App-205. The white circles within the violin plots represent the mean and the white bars represent ±one standard deviation.

