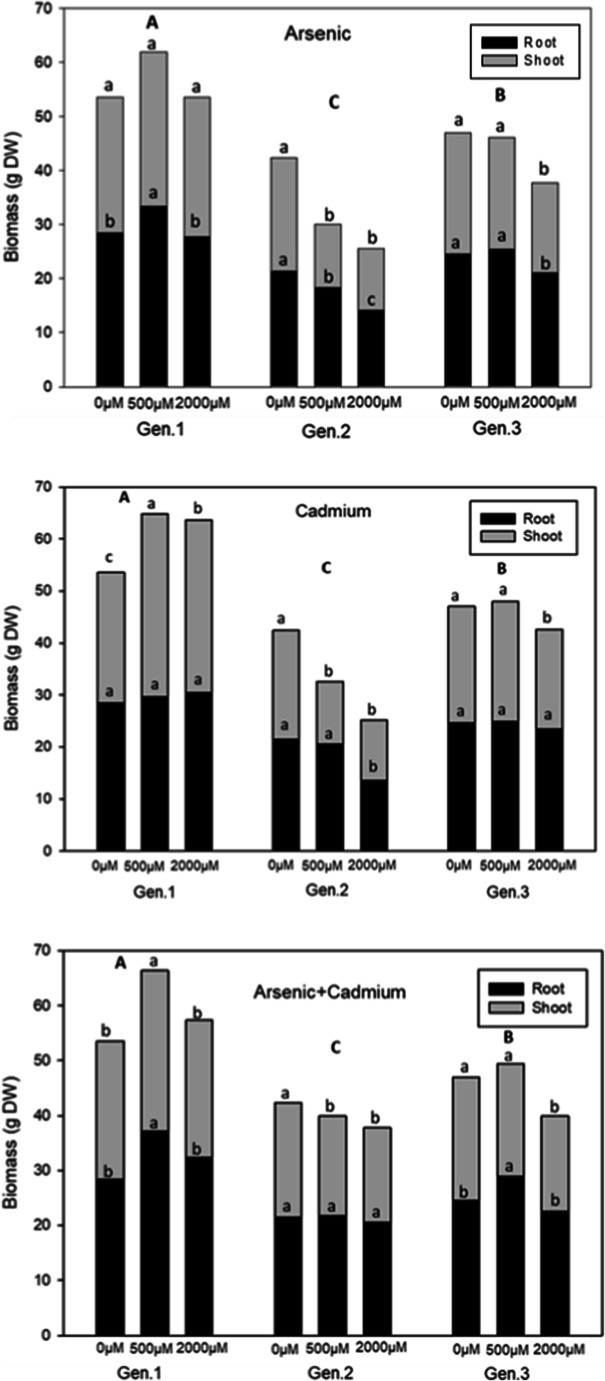
Fig. 1.
Root and shoot biomass of cardoon genotypes in response to As, Cd and As+Cd treatments at 45 days after contamination. Values are expressed as mean of biological replicates (n = 3). Different uppercase letters indicate statistically significant differences among the biomass on different levels contaminations among the genotypes. Different lowercase letters indicate statistically significant differences among the biomass on different levels contaminations among the same genotype (p≤0.05)

