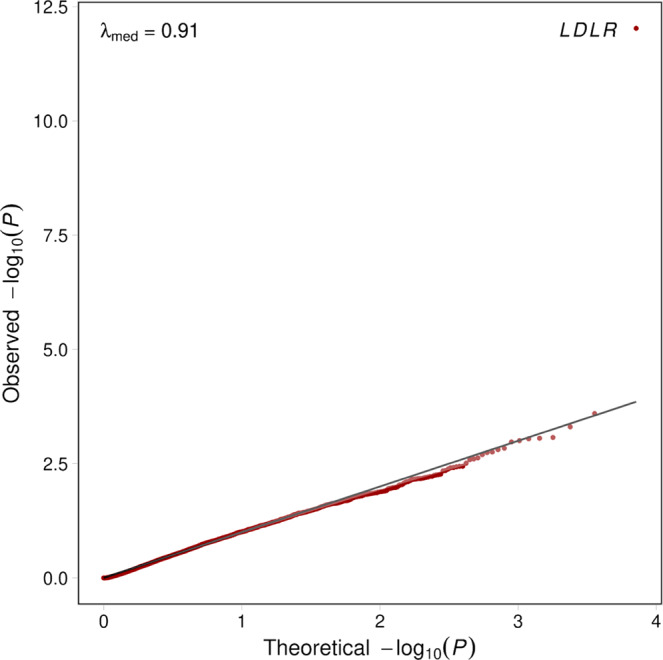
Fig. 6. Quantile-quantile plot for discovery gene-based test statistics generated using RV-EXCALIBER for 5910 case participants from MIGen.

A total of 7146 protein-coding genes with OAC ≥1 in MIGen and EAC ≥10 in gnomAD non-Finnish Europeans were used to conduct a gene burden testing with the RV-EXCALIBER method. Association testing was conducted using 5,910 MI cases in MIGen and gnomAD non-Finnish Europeans as controls. The genomic inflation estimate at the median (λmed was determined to be 0.91. The solid black line indicates an expected uniform distribution of P-values under the null and the shaded region represents the 95% confidence interval of the expected uniform distribution of P-values. log10(P) refers to the log base 10 of a gene-based P-value. Source data are provided as a Source data file.
