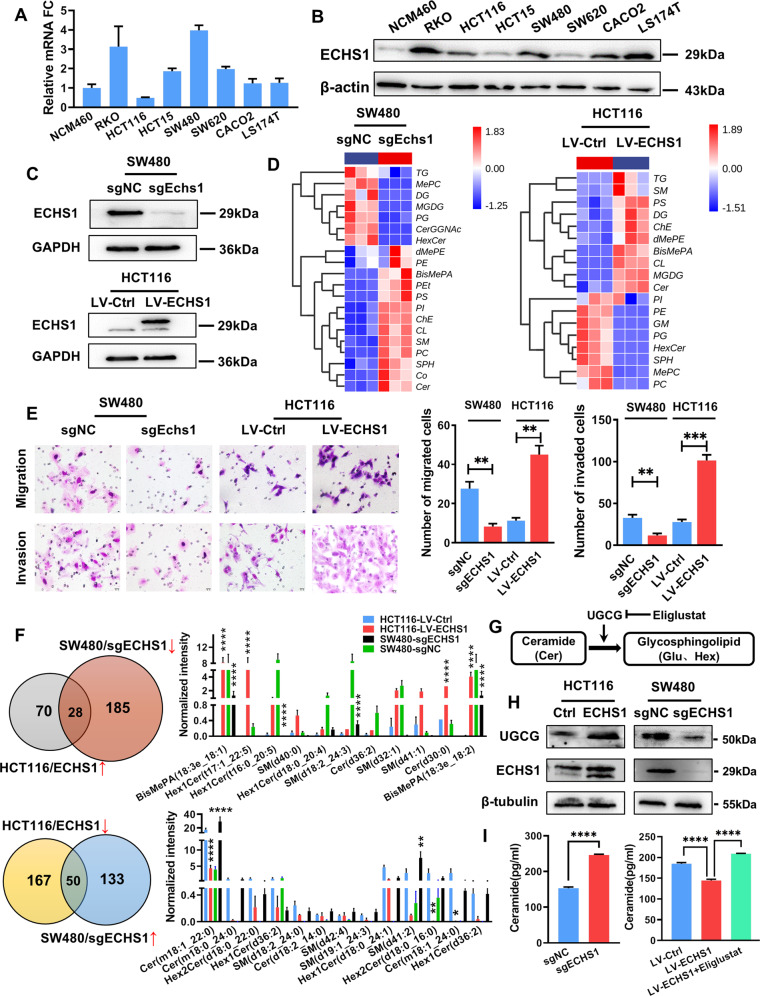
Fig. 3. ECHS1 promotes the conversion of ceramide to glycosylated ceramide by regulating UGCG.
A, B RT-PCR (A) and Western blot analysis (B) were used to detect the expression of ECHS1 in CRC cell lines. C Western blot analysis showed that ECHS1-knockout and -overexpression cells were constructed. D Left panel: heatmap of the LC–MS assay for SW480sgECHS1 and SW480sgNC cells. Right panel: heatmap of the LC–MS assay for HCT116-LV-ECHS1 and HCT116-LV-Ctrl cells. E Representative figures and data of the Transwell assay for SW480sgECHS1, SW480sgNC, and HCT116-LV-ECHS1 and HCT116-LV-Ctrl cells. Bars in the right panel represent the number of migrated and invaded cells. The triple asterisk (***) indicates P < 0.001. F Upper panel: pi chart of lipids associated with the elevation of endogenous ECHS1. Bars in the right panel represent the lipids associated with phospholipid metabolism. Lower panel: pi chart of lipids associated with the reduction in endogenous ECHS1. Bars in the right panel represent the lipids associated with phospholipid metabolism. G Schematic diagram of UGCG regulating ceramide glycosylation. H Western blot analysis showed the expression of UGCG when endogenous ECHS1 changed in CRC cells. I Histogram of ELISA results showing the expression of endogenous ceramide when ECHS1 was overexpressed or knocked out in CRC cells.

