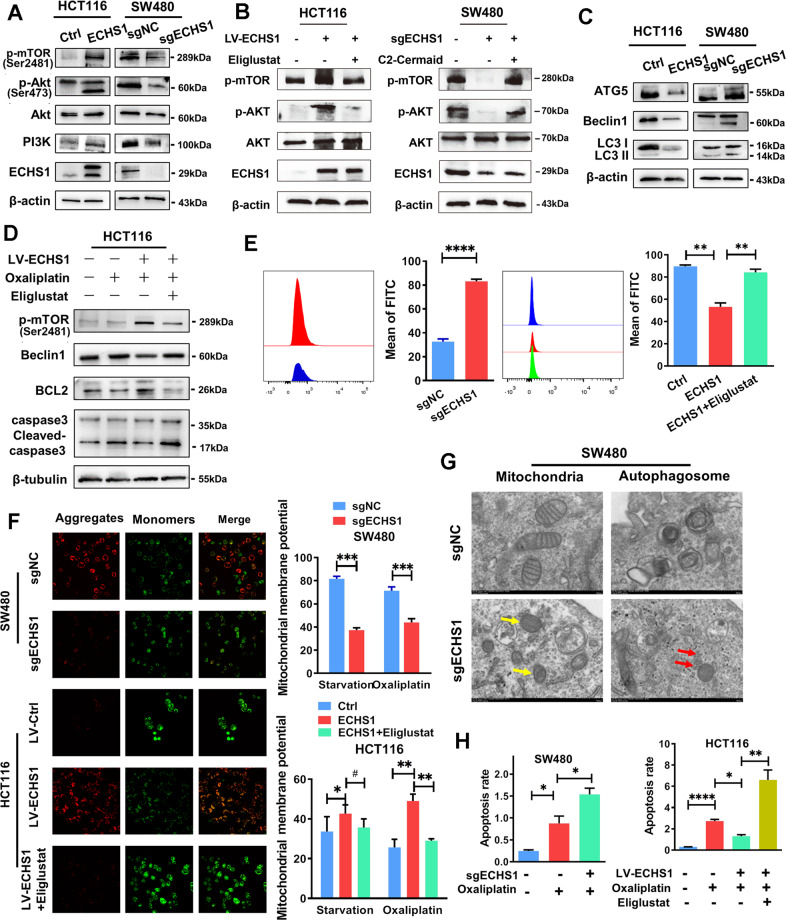
Fig. 4. ECHS1 resists autophagy and apoptosis of CRC cells through the PI3K-Akt-mTOR pathway mediated by ceramide.
A Western blot analysis of the expression of PI3K/Akt/mTOR pathway members (PI3K, Akt, phosphorylated AKT at Ser473, and phosphorylated mTOR) in ECHS1-overexpressing or ECHS1-knockout CRC cells. B Western blot analysis of the expression of PI3K/Akt/mTOR pathway members in ECHS1-overexpressing cells with the application of the inhibitor of UGCG eliglustat (left panel) or in ECHS1-knockout cells with the addition of C2 ceramide (right panel). C Western blot analysis of the expression of autophagy-related proteins (ATG5, Beclin1, and LC3II/LC3I). D Western blot analysis of phosphorylated mTOR, Beclin1, BCL2, and caspase3 in CRC cells with or without ECHS1 overexpression and Eliglustat (100 nmol). E Flow cytometry analysis of intracellular ROS content. Bars in the right panel represent the average fluorescence intensity. F IF assay analysis of JC-10 aggregates (red) and monomers (green) in the mitochondrial matrix with or without starvation (2 h) and Eliglustat (100 nmol). Bars of the right panel represent the ratio of the average fluorescence intensity of monomers (green) and aggregates (red). G Electron microscopy results show mitochondrial morphology (yellow arrows) and autophagosomes (red arrows) in ECHS1-knockout SW480 cells. H Histogram of flow cytometry assay showing the ratio of the average fluorescence intensity of apoptotic cells with or without Oxaliplatin (20 µg/µl) and Eliglustat (100 nmol).

