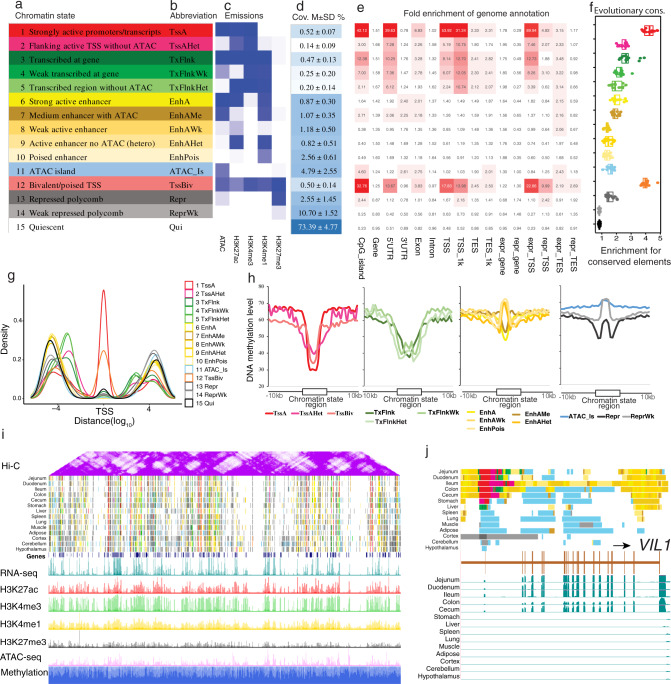
Fig. 2. Chromatin landscape across 14 tissues.
a, b Definitions and abbreviations of 15 chromatin states. c Emission probabilities of individual epigenetic marks for each chromatin state. The color from white to deep blue indicates emission probability (0–1). d Genomic coverage of each chromatin state. M ± SD mean ± standard deviation. e Average enrichment of chromatin states for genomic annotations, including CpG islands, genes, TSS/TES_1K (±1 kb around TSS and TES), expressed genes (TPM ≥ 0.1), and repressed genes (TPM < 0.1) in each tissue. f Fold enrichments of chromatin states for non-coding mammalian conserved elements from Genomic Evolutionary Rate Profiling (GERP). Whiskers show 1.5× interquartile range. Each data point represents one of 14 different tissues. g Density of each chromatin state in positions relative to gene TSS. h Average methylation level of chromatin states in jejunum. i Hi-C (250 kb resolution), predicted chromatin states, epigenetic signal, and normalized methylation level in jejunum across chromosome 7. j Chromatin state landscape and mRNA expression at VIL1 locus (chr15:120,459,825-120,493,312, susScr11) across 14 tissues. Vertical scale of UCSC tracks shows normalized signal from 0 to 200 for RNA-seq.

