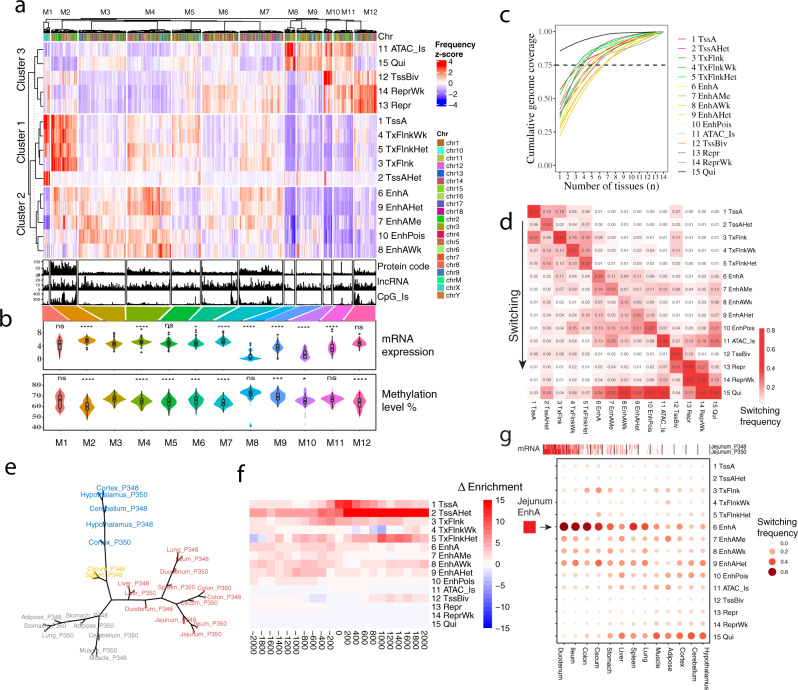
Fig. 3. Genome-wide chromatin state dynamics across tissues.
a Clustering of 2 Mb intervals (1224 columns) into modules (M1–M12) based on average chromatin state frequency across tissues in each interval. Number of protein-coding genes, lncRNA, and CpG islands in each interval shown in bottom. b Average mRNA expression (log2(TPM + 1)) of genes and average methylation level of 2 Mb intervals belonging to each module. M1–M12 module was comprised of 24, 100, 183, 167, 111, 139, 168, 41, 98, 33, 75, 85 intervals, respectively. M3 was used as reference for the statistical two-sided t-test, where *P < 0.05, **P < 0.01, and ***P < 0.001. P values of gene expression (M1 = 0.33, M2 < 2.2e-16, M4 = 4.8e-10, M5 = 0.15, M6 = 0.017, M7 = 1e-14, M8 < 2.2e-16, M9 = 3.3e-10, M10 = 2.5e-15, M11 = 8.6e-08, M12 = 0.08); P values of methylation level (M1 = 0.066, M2 < 2.2e-16, M4 = 6.7e-09, M5 = 8.1e-07, M6 = 0.00027, M7 < 2.2e-16, M8 = 0.1, M9 = 0.00028, M10 = 0.049, M11 = 0.26, M12 = 5.5e-07). No adjustment was made for multiple comparisons. Whiskers show 1.5× interquartile range. Black circles were outliers. c Chromatin state variability based on cumulative genome coverage fraction. Dashed line = 0.75. d Chromatin state switching between all tissues. e Hierarchical epigenome clustering using H3K4me1 signal in EnhA states. f Chromatin state enrichment in promoters of genes with jejunum-specific expression, relative to muscle. g Chromatin state switching of target enhancers (EnhA) of jejunum-specific genes in other tissues.

