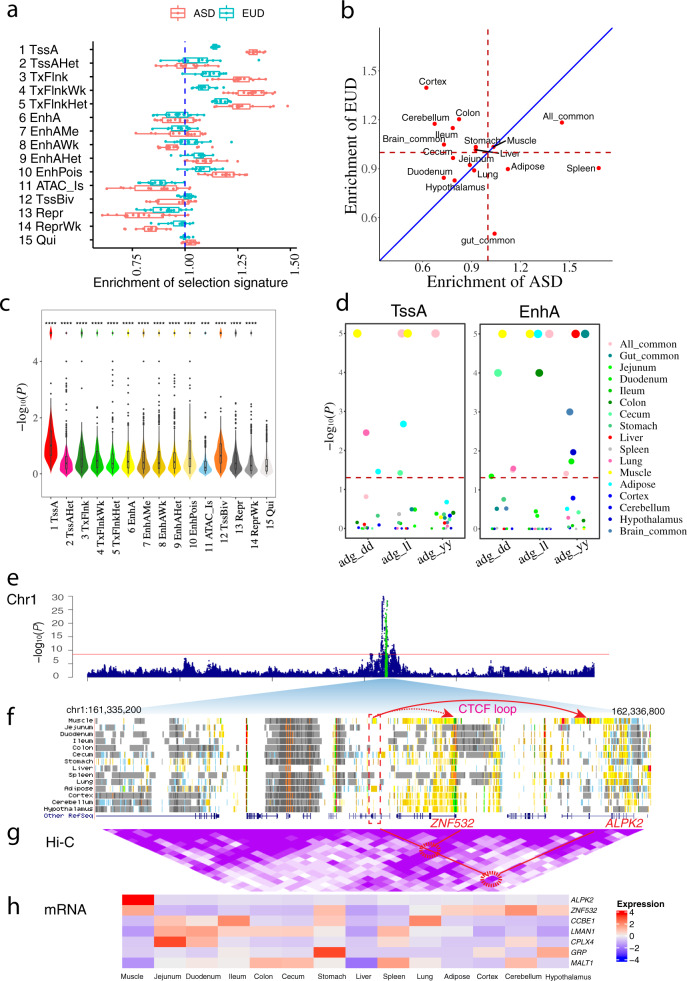
Fig. 5. Chromatin state plays an important role in pig domestication and complex traits.
a Domestication selection signature enrichment within chromatin states in Asian and European pigs. ASD Asian pig domestication, EUD European pig domestication. Values greater than 1 (dashed line) indicate significant enrichment. Whiskers show 1.5× interquartile range. Each datapoint represents one of 14 different tissues. b Domestication selection signature enrichment in tissue-specific promoters (TssA) between Asian and European pigs. Values >1 (dashed line) indicate significant enrichment, measured by Fisher’s exact test. Deviation from the diagonal line shows a tissue’s enrichment tendency towards either Asian or European pigs. c Genome-wide association study (GWAS) signal enrichment within chromatin states across 14 tissues and 44 complex traits in pigs. The statistical significance of comparisons were calculated by two-sided t-test using “15 Qui” as a reference. No adjustment was made for multiple comparisons. ***P < 0.001. The P-value in each group were “1 TssA”<2.2e-16, “2 TssAHet”=9.1e-09, “3 TxFlnk”< 2.2e-16, “4 TxFlnkWk”=6.7e-16, “5 TxFlnkHet”=2.8e-12, “6 EnhA”<2.2e-16, “7 EnhAMe”=3.6e-16, “8 EnhAWk”=2.5e-16, “9 EnhAHet”<2.2e-16, “10 EnhPois”<2.2e-16, “11 ATAC_Is”= 0.00015, “12 TssBiv”<2.2e-16, “13 Repr”=7.1e − 15, and “14 ReprWk”=3.8e-10. Whiskers show 1.5× interquartile range. Black points were outliers. d GWAS signal enrichment of promoter (TssA) and strong enhancer (EnhA) tissue-specific regulatory elements (TSR) for average daily gain (ADG) in three pig populations (dd: Duroc, ll: Landrace, yy: Yorkshire). Significance was based on 10,000 iterations of a genotype cyclical permutation test. Dashed line set at −log10(P = 0.05). Values over the dashed line were significantly enriched. e Manhattan plot of ADG in the Landrace population (88,984). f Chromatin states for each tissue in a genomic region where GWAS hits were found. Dashed rectangular box includes a muscle-specific enhancer that coincides with GWAS hits. Arrows in red indicate predicted CTCF looping and H3K27ac signal, which together suggest that the muscle-specific enhancer may target ZNF532 and ALPK2. g Hi-C loop (25 kb resolution) depiction between a muscle-specific enhancer and putative target genes. Purple shading for the Hi-C data represents loop intensity (auto-scale). Two highlighted Hi-C loops delineated with red circles are potential contacts between a muscle-specific enhancer and ZNF532 and ALPK2. h Expression (normalized and centered TPM) of genes proximal to the muscle-specific enhancer.

