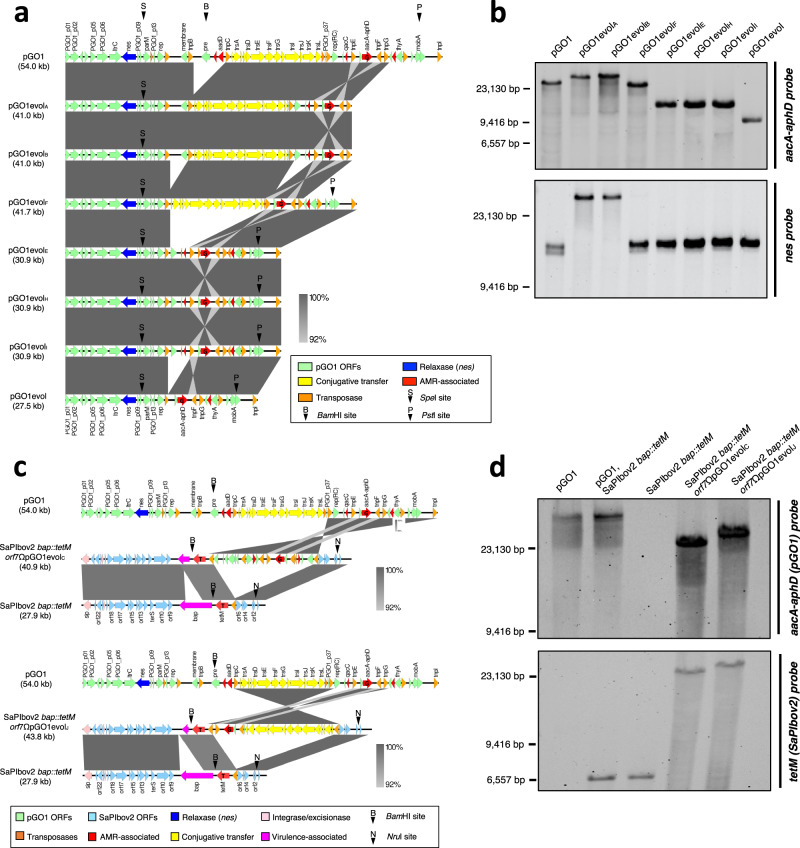
Fig. 4. Genetic maps of evolved pGO1 and pGO1-SaPIbov2 hybrid species.
a Sequence alignments of circular pGO1-derivative plasmids were performed using Easyfig software (v2.2.2). Genes are coloured according to their sequence and function. Black arrows indicate relevant restriction sites. b Plasmid sequences were affirmed using Southern blotting of total DNA digested with SpeI, BamHI and PstI, with probes against the aacA-aphD [‘G’] and nes regions encoding gentamicin resistance and the relaxase, respectively. Expected plasmid fragment sizes following triple digestion were as follows: pGO1, G: 30,498 bp, nes: 14,103 bp; pGO1evolA-B, G: 41,026 bp, nes: 41,026 bp; pGO1evolF, G: 27,634 bp, nes: 14,103 bp; pGO1evolE, H-I, G: 16,796 bp, nes: 14,103 bp; and pGO1evol, G: 13,471 bp, nes: 14,103 bp. c Sequence alignments of SaPIbov2 bap::tetM orf7ΩpGO1evolC and SaPIbov2 bap::tetM orf7ΩpGO1evolJ hybrid species were performed using Easyfig software (v2.2.2). Genes are coloured according to their sequence and function. Black arrows indicate relevant restriction sites. d SaPIbov2 bap::tetM orf7ΩpGO1evol sequences were affirmed using Southern blotting of total DNA digested with BamHI and NruI, with probes against the aacA-aphD region encoding gentamicin resistance [G] in pGO1, and the tetM cassette in SaPIbov2 bap::tetM [T], respectively. Expected fragment sizes following double digestion were as follows: pGO1, G: 54,000 bp, T: no band; SaPIbov2 bap::tetM, G: no band, T: 6,488 bp; SaPIbov2 bap::tetM orf7ΩpGO1evolC, G and T both 22,317 bp; and SaPIbov2 bap::tetM orf7ΩpGO1evolJ, G and T both 25,584 bp. See Supplementary Data 1 for details of recombination events and Table S2 for details of mobility mechanisms utilised by the variant pGO1 plasmids. See Supplementary Data 1 for details of recombination events, Table S2 for details of mobility mechanisms utilised by the variant pGO1 plasmids, and Table S3 for details of relative fitness of the variant pGO1 plasmids compared to the parental pGO1. Panels b and d are representative of data obtained from three independent experiments (n = 3) yielding similar results.

