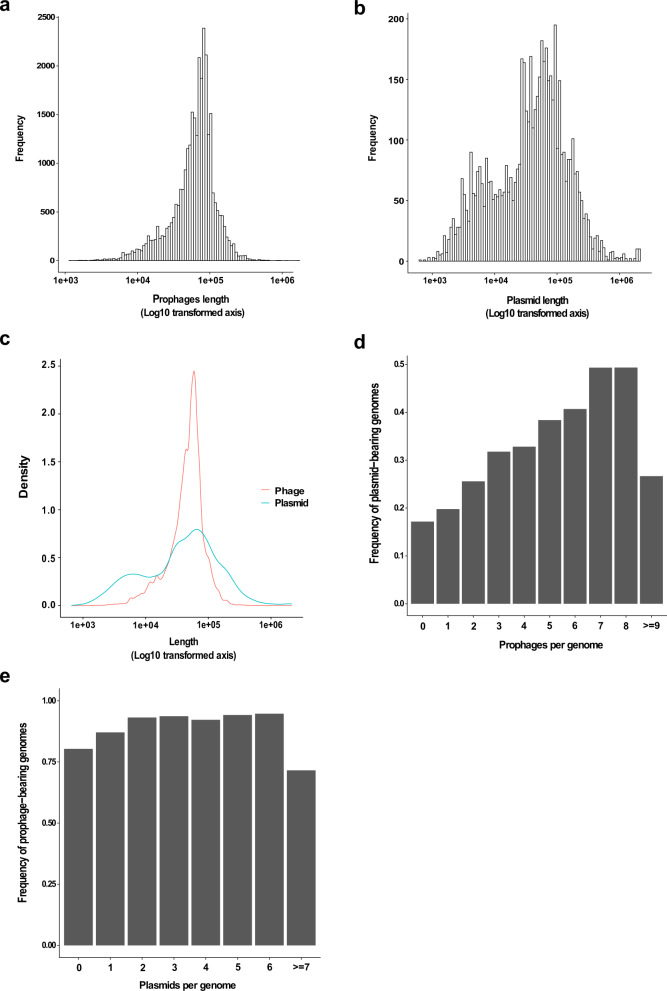
Fig. 8. Relationship between prophage and plasmid carriage in bacterial populations.
8903 complete bacterial genomes from the NCBI database were analysed for the presence of plasmids and prophages. a Size distribution analysis of prophages ranked according to length. b Size distribution analysis of plasmids according to length. c Comparison of the length distribution of prophages and plasmids. d The frequency of plasmid-bearing genomes was ranked according to the number of prophages per genome, with the maximum rank of 9 being equal to or greater than 9 prophage genomes per record. Slope: y = 0.027, indicates a positive correlation between increasing plasmid frequency with increasing prophages. e The frequency of prophage-bearing genomes was ranked according to the number of plasmids per genome, with the maximum rank of 7 being equal to or greater than 7 plasmids genomes per record. Slope: y = −0.0026, indicates no clear relationship between increasing prophage frequency and increasing plasmid carriage.

