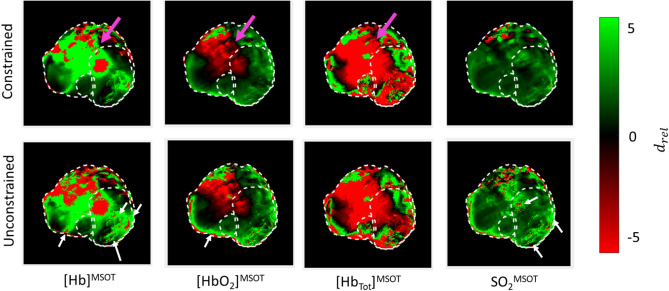
Figure 10.
Relative Cohen’s d (Supplementary Information) of drug administration calibrated against oxygen-air transition during initial gas challenge in Dataset A. In both constrained and unconstrained [Hb]MSOT and [HbO2]MSOT images, there is a large region of anomalous relative effect (magenta arrows), likely due to changes in measured [Hbtot]MSOT over the course of the experiment. This large region is absent in the SO2MSOT analyses due to the ratiometric calculation. More localized artifacts such as those highlighted in the unconstrained analysis (white arrows) are due to modelling or reconstruction inaccuracies, and so are not compensated by calculating SO2MSOT. Figure created using a combination of MATLAB and Microsoft PowerPoint.

