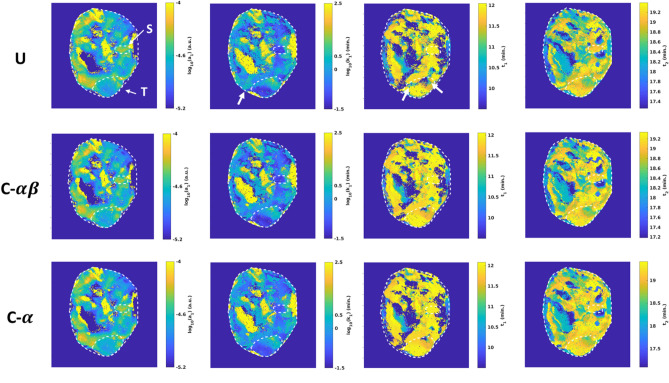
Figure 13.
Selected parameters from fitting Dataset B using 7-parameter monoexponential model (Supplementary Information) using three different processing approaches. U: Unconstrained analysis. C-: Constrained analysis using Kalata filter. C-: Constrained analysis using Kalata filter. Although performance of the model fit is similar across much of the imaged area, the unconstrained analysis assigns inaccurate values of switching times to a large region on the interior of the tumor (white arrows). Figure created using a combination of MATLAB and Microsoft PowerPoint.

