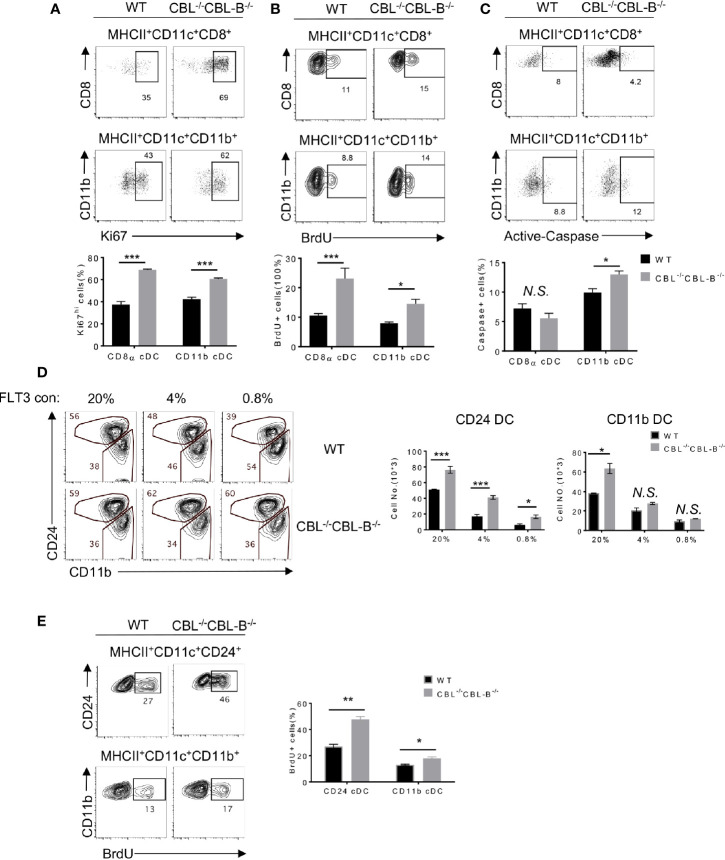
Figure 2.
Proliferation, death, and lineage commitment of WT and CBL-/-CBL-B-/- cDCs. (A–C) Flow cytometry (top panels) and statistics (bottom panels) of splenic proliferating (A, B) and apoptotic (C) CD8α+ cDC1s and CD11b+ cDC2s, as determined respectively by anti-Ki67 (n = 3) (A), BrdU (n = 6) (B), and anti-Active Caspase (n = 3) (C) staining. (D) Comparison of WT and CBL-/-CBL-B-/- CD24+ (CD8α+-like) cDC1s and CD11b+ cDC2s in FLT3 dependent BM cell culture. Shown are the contour maps (left) and statistics (right) of CD24 vs CD11b staining of the gated CD11c+ cells (n = 3). (E) Proliferation of WT and CBL-/-CBL-B-/- cDC generated in FLT3 dependent BM cell culture. Shown are FACS analyses (left) and statistics (right) of BrdU+ CD24hiCD11blo and CD24loCD11bhi cells (n = 3). Data are mean ± SEM. of at least two independent experiments. N.S., not significant; *p < 0.05; **p < 0.01; ***p < 0.001.

