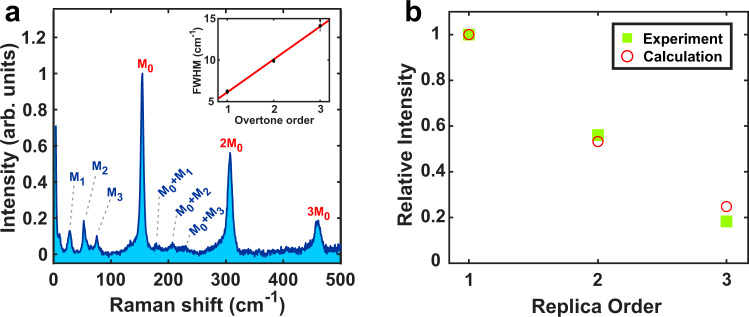
Fig. 1. MPRS results for CsPbBr3 nanocrstals (NCs).
a MPRS spectrum of CsPbBr3 NCs at 3.8 K. The labels represent the different phonon modes observed and their combinations. The inset shows an increase of the FWHM for consecutive overtones. The FWHM values and their respective errorbars were obtained via Gaussian fitting of each peak. The red line is a guide to the eye. b Experimental and calculated intensities of the M0 replicas in a. Calculations assume S = 0.39, σ = 32.5 meV, Γ0 = 1 meV, and eV. The maximum relative measurement error corresponds to the third-order replica, and is around 10%, due to the subtraction of the PL background. The sum of squared residuals for the fit is 0.005.

