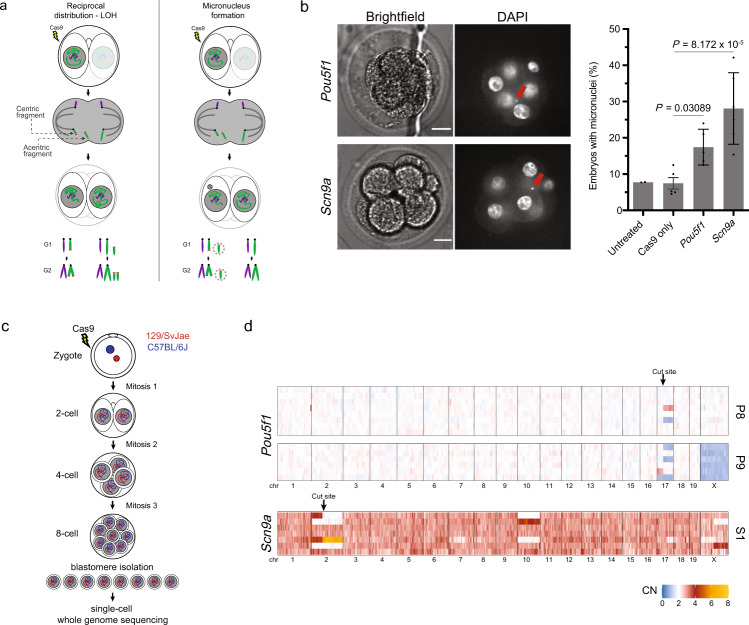
Fig. 1. Copy number alterations and micronucleation from CRISPR-Cas9 genome editing in mouse embryos.
a Schematic of two chromosome segregation errors following Cas9 treatment in cleavage stage mouse embryos. Left, missegregation of the Cas9-induced acentric fragment to one daughter and segregation of the centric fragment to the other generates a reciprocal gain/loss copy number (CN) pattern. LOH is loss of heterozygosity. Right, the acentric fragment segregates to the same daughter as the centric fragment but is partitioned into a micronucleus. Because of defective DNA replication in the micronucleus, in G2 cells, the acentric fragment will have ~0.5 CN of the centric fragment. Targeted chromosome: green; normal chromosome: purple. Cas9 cut site is marked in red. b Micronucleus formation after CRISPR-Cas9 treatment. Left, representative single z-focal plane confocal images of 8-cell stage mouse embryos after CRISPR-Cas9 with Pou5f1 and Scn9a gRNAs that are quantified in the right panel. Red arrows: micronuclei. Right, percentage of 8-cell stage embryos with at least one micronucleus (n = 2, 5, 5, 6 experiments with 77, 97, 136, and 99 embryos, left to right). Error bars: mean ± SEM, two-tailed Fisher’s exact test against the “Cas9 only” group. Scale bars: 15 μm. Source data are provided as a Source Data file. c Schematic of the experimental strategy for single-cell whole-genome DNA sequencing. d Heatmap representing total CN for each chromosome for the P8 and P9 embryos after CRISPR-Cas9 treatment with the Pou5f1 and S1 with the Scn9a gRNAs. Bin size: 5 Mb. Arrows indicate the genomic location of the targeted cleavage site for the indicated gRNAs. Note: the S1 embryo is triploid (see main text and Supplementary Data 1).

