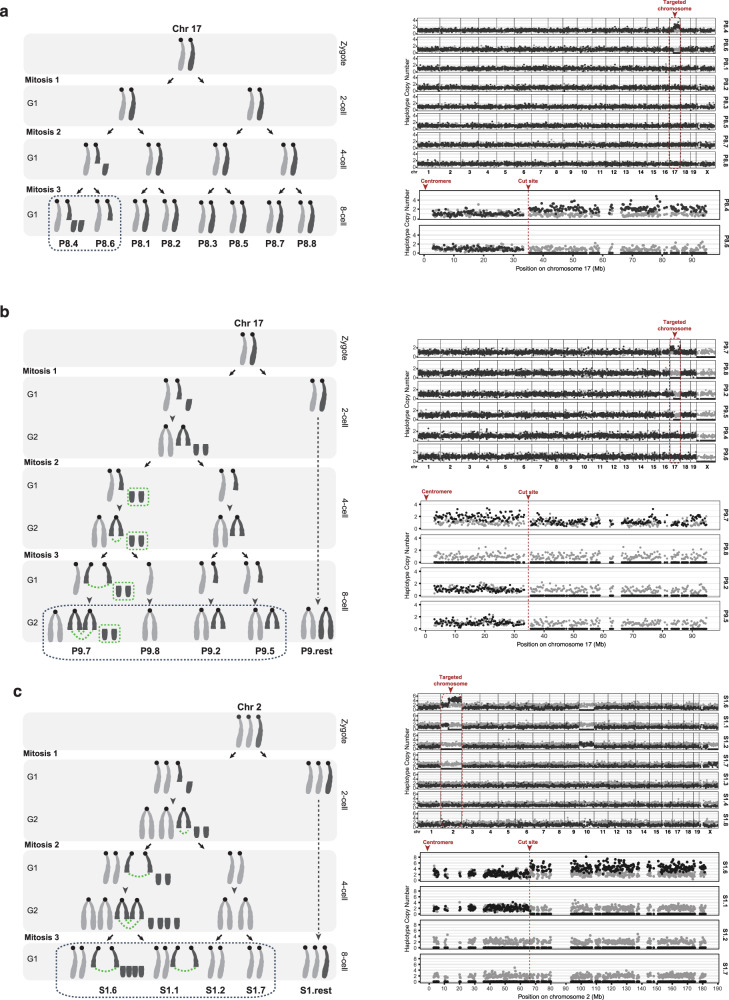
Fig. 2. Complex karyotype alterations and whole chromosome monosomy after CRISPR-Cas9 treatment in embryos.
a Left, illustration of the inferred karyotype alterations during the development of the P8 embryo (Pou5f1 gRNA). Chromosomes are shaded to indicate parental haplotype. Right top: relative haplotype copy number scatter plots for all chromosomes in all blastomeres (1 Mb bins, dark gray dots: 129/SvJae; light gray dots: C57BL/6J). Black dotted boxes: blastomeres shown in the bottom right panel; Right bottom: zoomed view of relative haplotype copy number plots for the targeted chromosome (250 kb bins). b P9 embryo (Pou5f1 gRNA), as in (a) above. Green dotted box: micronucleus; green dotted curves: chromosome bridges. The acentric chromosome fragment of the targeted chromosome 17 forms a micronucleus at the 4-cell stage and undergoes poor DNA replication. Fusion of the break ends of the centric fragments generates a dicentric chromosome. CN data suggest that this embryo, unlike the others, was harvested with its cells in the G2 phase, which is why the diagram on the left illustrates CN values of either two or four. The CN plots on the right have been normalized to one, and therefore have values of either one or two. See Supplementary Fig. 4 for alternative explanations of some features of the CN patterns. c S1 embryo (Scn9a gRNA), as in (a) and (b) above. The centric fragments of the targeted chromosome form a chromosome bridge at the 2-cell stage and all the acentric fragments missegregate in mitosis 2 and 3 to the daughters containing the centric fragments. Notes: the Cas9 cut in (b) and (c) can be introduced either on a single chromatid in G1 or in both sister chromatids in G2 (shown here is G1 cleavage). See Supplementary Fig. 4 for alternative explanations of some features of the CN patterns.

