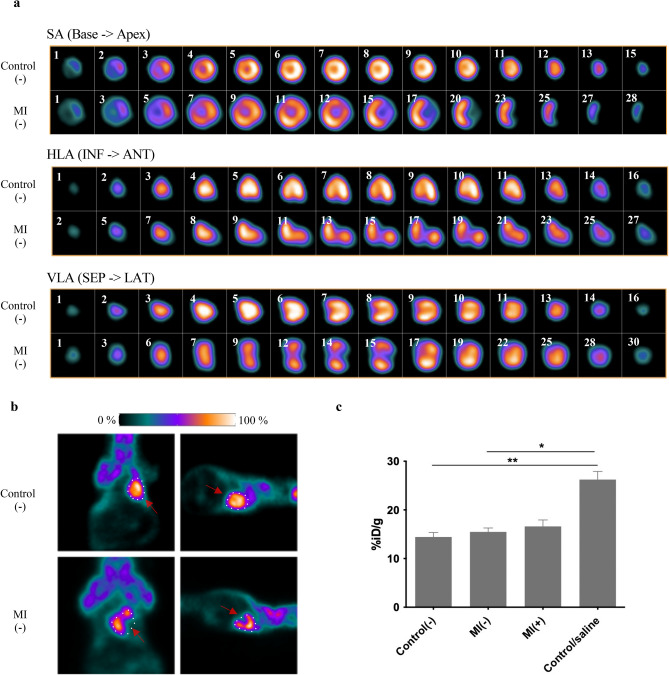
Figure 2.
Functional and metabolic heart characteristics. (a) Images show a summary of cardiac viability measurements in control(−) (top row) and MI(−) (bottom row) mice administered the [18F]-FDG tracer. Note the presence of MI in the apex area in axial, coronal, and sagittal planes (from top to bottom) and a larger size of the post-infarction heart due to its remodelling. (b) Representative PET images in the dorsal and lateral positions. Red arrows show loss of uptake in apex area (c) Comparison of cardiac [18F]-FDG uptake in a group of control(−), MI(−) and MI(+) mice 7 days after cell implantation into the post-infarction heart and after saline injection. Statistical significance was evaluated with ANOVA and p-values are given as the mean ± SD; *p < 0.05, **p < 0.01.

